📊 VPOC MONTE CARLO EXPECTED VALUE
https://chartshots.spotware.com/c/69c558e2c68df
การวิเคราะห์ตลาดแบบบูรณาการ: โปรไฟล์ปริมาณ + การคาดการณ์ทางสถิติ 🎯
🎯 มันคืออะไร?
VPOC Monte Carlo Expected Value คือดัชนีวิเคราะห์เชิงปริมาณที่รวมสองวิธีการเทรดมืออาชีพเข้าด้วยกัน:
- โปรไฟล์ความลึกของตลาด (VPOC) - ระบุว่าปริมาณจริงๆ รวมตัวอยู่ที่ไหน 🏦
- การจำลองมอนติคาร์โล - คาดการณ์สถานการณ์ในอนาคตโดยอิงจากความน่าจะเป็นทางสถิติ 📈
ผลลัพธ์คือระบบวิเคราะห์ที่บอกคุณว่ามีเงินอยู่ที่ไหน (จุดควบคุม) และมันน่าจะไปที่ไหน (ค่าที่คาดหวังที่คาดการณ์ไว้) 🧠
⚙️ มันทำงานอย่างไร?
โมดูล 1: โปรไฟล์ความลึก (VPOC) 📊
ดัชนีวิเคราะห์แท่งเทียนล่าสุด 200 แท่ง (ปรับแต่งได้) และแจกแจงปริมาณใน 30 ระดับราคา คำนวณ:
- จุดควบคุม (PoC): ราคาที่มีปริมาณการซื้อขายสูงสุด - แสดงถึงความเห็นพ้องของตลาดที่ผู้ซื้อและผู้ขายมีความเคลื่อนไหวมากที่สุด ⚖️
- เดลต้า: ความแตกต่างระหว่างแรงกดดันซื้อกับขายในแต่ละระดับ 🔄
- ฮีทแมป: การแสดงภาพความเข้มข้นของกิจกรรม 🔥
ตรรกะ: ราคามักจะกลับไปยัง PoC เพราะนั่นคือที่ที่มีสภาพคล่องรอดำเนินการมากที่สุด หากราคาห่างจาก PoC มีความน่าจะเป็นสูงที่จะกลับ 🔄
โมดูล 2: การคาดการณ์ทางสถิติ (Monte Carlo) 🎲
ใช้การจำลองแบบสุ่ม (1,000 รอบโดยค่าเริ่มต้น) เพื่อคาดการณ์ราคาล่วงหน้า:
- คำนวณแนวโน้มประวัติศาสตร์ของสินทรัพย์และความผันผวนรายปี 📉📈
- สร้างเส้นทางสุ่มโดยใช้การแจกแจงปกติ (โมเดลการเคลื่อนที่แบบบราวเนียนเรขาคณิต) 🌊
- ประมาณค่าคาดหวังพร้อมแถบส่วนเบี่ยงเบนมาตรฐาน (±1 ซิกมา) 📏
สูตรที่ใช้: - การลอยตัวต่อแท่ง = ผลตอบแทนรายปี / วันซื้อขาย 🧮
- ความผันผวนต่อแท่ง = ความผันผวนรายปี / √วัน ⚡
- การคาดการณ์ = ราคาปัจจุบัน × e^(การลอยตัวรวม + สุ่มปกติ × ความผันผวนรวม) 🔢
โมดูล 3: การประสานงาน 🔗
รวมการวิเคราะห์ทั้งสองเพื่อสร้างสัญญาณตามบริบท:
ตาราง
สัญญาณ เงื่อนไข ความหมาย
ขาขึ้น ↑ 🟢 ราคา > PoC + การคาดการณ์บวก แนวโน้มขาขึ้นได้รับการยืนยันโดยปริมาณ
ขาลง ↓ 🔴 ราคา < PoC + การคาดการณ์ลบ แนวโน้มขาลงได้รับการยืนยันโดยปริมาณ
โอกาส ★ 💡 ราคา < PoC + การคาดการณ์บวก อาจมีการดีดตัวจากการสนับสนุนของปริมาณ
ความแตกต่าง ⚠️ ⚠️ ราคา > PoC + การคาดการณ์ลบ เตือนถึงการกลับตัวที่อาจเกิดขึ้น
📈 ใช้ทำอะไร?
✅ ระบุระดับปริมาณสำคัญ - PoC ทำหน้าที่เป็นแม่เหล็กราคา 🧲
✅ ประเมินความน่าจะเป็นของความสำเร็จ - เปอร์เซ็นต์ของสถานการณ์ที่ชนะในการจำลอง 🏆
✅ ประเมินความเสี่ยง/ผลตอบแทน - อัตราส่วน Sharpe ที่คาดการณ์และส่วนเบี่ยงเบนมาตรฐาน 📊
✅ ยืนยันทิศทางการเทรด - การประสานงานระหว่างตำแหน่งเทียบกับ PoC และโมเมนตัมทางสถิติ 🎯
✅ การคาดการณ์เป้าหมาย - ระดับราคาที่คาดหวังสำหรับระยะเวลาถือที่กำหนด 🎯
🎮 การตั้งค่าและการใช้งาน
พารามิเตอร์หลัก:
ตาราง
กลุ่ม พารามิเตอร์ ค่าเริ่มต้น คำอธิบาย
ช่วงเวลาวิเคราะห์โปรไฟล์ความลึก 200 แท่ง ประวัติสำหรับคำนวณโปรไฟล์ปริมาณ
ระดับราคา 30 ความละเอียดโปรไฟล์ (ระดับมาก = รายละเอียดมากขึ้น) 🔍
การเลื่อนแนวนอน 5 ตำแหน่งโปรไฟล์บนแผนภูมิ 📏
ระยะเวลาการดำเนินการสูงสุดของการคาดการณ์ทางสถิติ 252 แท่ง ช่วงเวลาของการคาดการณ์ ⏱️
เงินลงทุน $1,000 ฐานสำหรับการคำนวณทางการเงิน 💰
จำนวนการจำลอง 1,000 จำนวนเส้นทางสุ่ม (มาก = แม่นยำขึ้น ช้าลง) 🔄
อัตราปลอดความเสี่ยง 5% สำหรับการคำนวณอัตราส่วน Sharpe 📉
ใช้กลยุทธ์ประวัติศาสตร์ ใช่/ไม่ ใช้งานเพื่อจำลองด้วยเป้าหมายคงที่ 🎯
วิธีตีความตารางผลลัพธ์:
ธรรมดา
คัดลอก
สถิติค่าที่คาดหวัง
┌──────────────┬─────────┬─────────┬─────────┬────────┐
│ วิธี │ จำนวน $│ ผลตอบแทน %│ อัตราชนะ│ Sharpe │
├──────────────┼─────────┼─────────┼─────────┼────────┤
│ ประวัติศาสตร์ │ -$19.56 │ -1.96% │ 47.2% │ -1.24 │
│ การจำลอง │ -$54.05 │ -5.40% │ 21.4% │ -4.95 │
└──────────────┴─────────┴─────────┴─────────┴────────┘
- ประวัติศาสตร์: ผลงานเฉลี่ยของการเทรดในอดีตที่คล้ายกัน 📜
- การจำลอง: ผลลัพธ์เฉลี่ยของการจำลองมอนติคาร์โล 1,000 ครั้ง 🎲
- อัตราชนะ: เปอร์เซ็นต์ของสถานการณ์ที่มีผลลัพธ์บวก ✅
- Sharpe: ผลตอบแทนปรับความเสี่ยง (มากกว่า 1 ดี, ติดลบไม่ดี) 📈
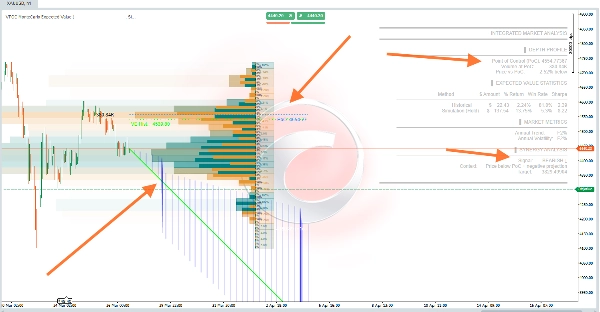
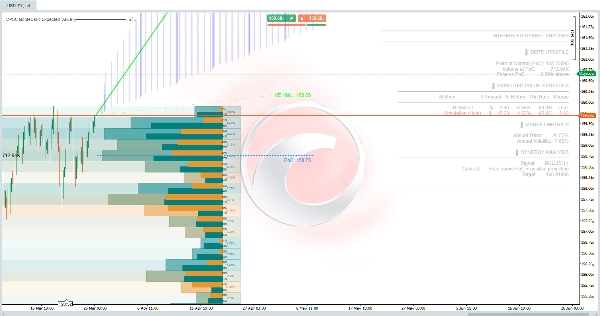
🖼️ องค์ประกอบภาพบนแผนภูมิ
ตาราง
องค์ประกอบ สี ความหมาย
โปรไฟล์ปริมาณ สีส้ม/น้ำเงินไล่ระดับ ความเข้มข้นของกิจกรรมตามระดับราคา 🎨
เส้น PoC จุดสีน้ำเงินประ จุดควบคุมที่คาดการณ์ในอนาคต 🔵
เส้นคาดการณ์ EV สีเขียว/ม่วง เส้นทางราคาที่คาดหวัง 🟢🔴
แถบ ±1σ เส้นประสีขาว ช่วงความเชื่อมั่น 68% 📊
เส้น EV ประวัติศาสตร์ เส้นประสีเขียว ค่าที่คาดหวังตามข้อมูลประวัติ 🟢
โซนการคาดการณ์ สีฟ้าโปร่งใส พื้นที่ความน่าจะเป็นระหว่างแถบ 🔵
⚠️ สิ่งสำคัญ - ข้อจำกัด
- ไม่ใช่สัญญาณซื้อ/ขาย - เป็นเครื่องมือวิเคราะห์เชิงความน่าจะเป็น 🛠️
- การจำลองมอนติคาร์โลสมมติว่าการแจกแจงในอดีตยังคงอยู่ (ไม่ทำนายเหตุการณ์หงส์ดำ) 🦢❌
- PoC เป็นแบบไดนามิก - คำนวณใหม่ในแต่ละแท่งเทียน 🔄
- ต้องการประวัติข้อมูลเพียงพอ - อย่างน้อย 252 แท่งเพื่อการคาดการณ์ที่เชื่อถือได้ 📊
- สกุลเงินดิจิทัล - ดัชนีปรับอัตโนมัติเป็น 365 วันซื้อขายต่อปี เทียบกับ 252 วันของตลาดทั่วไป 🪙
💡 กลยุทธ์การใช้งานที่แนะนำ
- มองหาโอกาส ★ 💡 - ราคาต่ำกว่า PoC แต่มีการคาดการณ์บวก (อาจถูกประเมินค่าต่ำเกินไป)
- ยืนยันด้วยอัตราชนะ > 50% - ความน่าจะเป็นทางสถิติของความสำเร็จสูงขึ้น ✅
- หลีกเลี่ยงความแตกต่าง ⚠️ ⚠️ - ราคาประเมินค่าสูงเกินไปเทียบกับปริมาณจริง
- ใช้ PoC เป็นจุดอ้างอิง - จุดหยุดหรือเป้าหมายรอบระดับสภาพคล่องนี้ 🎯
- เปรียบเทียบประวัติศาสตร์กับการจำลอง - หากแตกต่างกันมาก แสดงว่าระบบตลาดกำลังเปลี่ยนแปลง 🔄


!["Gaussian Channel [Iridio Capital]" โลโก้](https://cdn.ctrader.com/image/webp/7c039209-5573-4a54-a072-f9528b503103_41960)