present
ลงทะเบียนและรับส่วนลด $50 สำหรับการซื้อครั้งแรกของคุณ
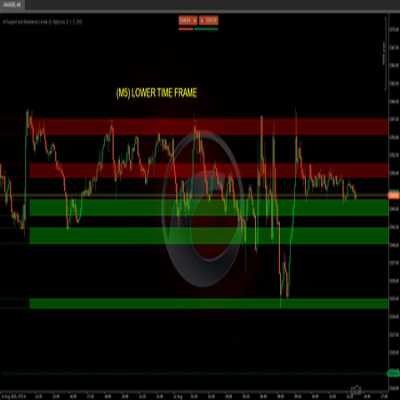
Trading product for Royal liquidity X อินดิเคเตอร์ Supertrend Liquidity Sweep, image 1
Royal liquidity X
อินดิเคเตอร์
เวอร์ชัน 1.0, May 2026
Windows, Mac
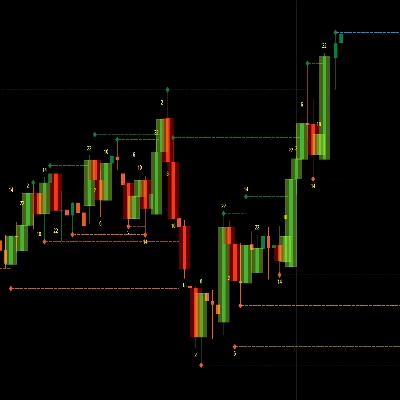
Trading product for Royal liquidity X อินดิเคเตอร์ Supertrend Liquidity Sweep, image 2
Trading product for Royal liquidity X อินดิเคเตอร์ Supertrend Liquidity Sweep, image 3
86
การขาย
1.18K
ติดตั้งฟรี

คำอธิบาย

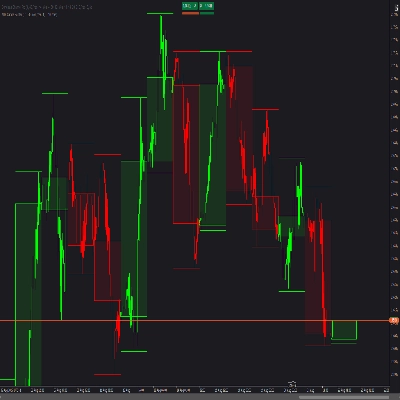
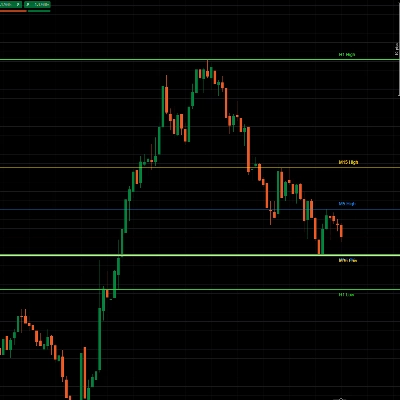
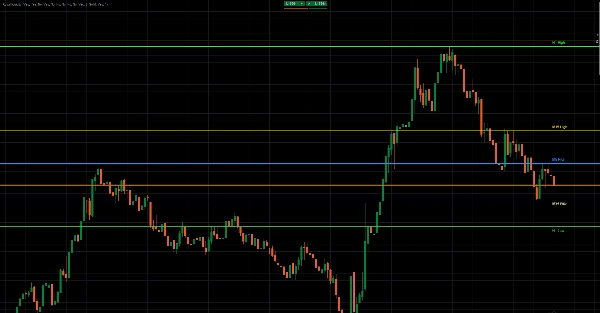
Royal Liquidity X is a clean and powerful multi-timeframe liquidity level indicator designed to display the previous high and previous low from multiple key timeframes directly on the chart.

The indicator helps traders quickly identify important liquidity zones where price may react, sweep liquidity, reject, break out, or continue with momentum. By plotting previous highs and lows from timeframes such as M5, M15, M30, H1, H2, H3, H4, H8, H12, and D1, Royal Liquidity gives traders a clear overview of the most relevant intraday and higher-timeframe liquidity levels.

These previous highs and lows are often watched by traders because they can act as potential stop-loss zones, breakout areas, reversal points, or price magnets. Royal Liquidity makes these levels visible automatically, without the need to manually draw them every session.

How It Works

Royal Liquidity reads the most recently closed candle from each selected timeframe. For every enabled timeframe, it takes the previous candle’s high and low and plots them as horizontal levels on the active chart.

For example:

M15 High = High of the last closed M15 candle
M15 Low = Low of the last closed M15 candle
H1 High = High of the last closed H1 candle
H1 Low = Low of the last closed H1 candle
D1 High = High of the last closed daily candle
D1 Low = Low of the last closed daily candle

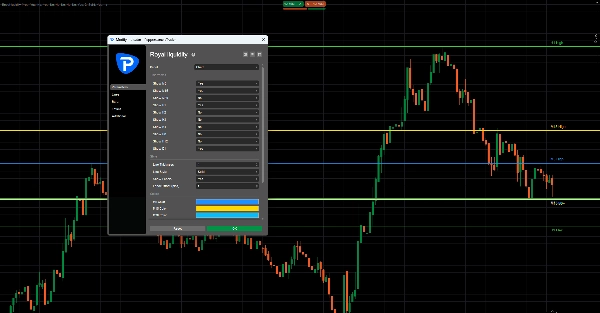
The indicator updates only on the latest chart bar, keeping the chart efficient and lightweight. Each timeframe can be turned on or off individually, and every level can have its own custom color. Traders can also adjust line thickness, line style, labels, and label offset.

What It Shows

Royal Liquidity can display:

Previous M5 High / Low
Previous M15 High / Low
Previous M30 High / Low
Previous H1 High / Low
Previous H2 High / Low
Previous H3 High / Low
Previous H4 High / Low
Previous H8 High / Low
Previous H12 High / Low
Previous D1 High / Low

Each level is drawn as a horizontal line, with optional labels such as M15 High, M15 Low, H1 High, H1 Low, and D1 High / Low.

Trading Use Cases

Royal Liquidity can help traders identify:

Liquidity sweeps
Price may move above a previous high or below a previous low to collect liquidity before reversing.

Breakout zones
A strong break above a previous high or below a previous low can signal continuation or momentum.

Reversal areas
Previous highs and lows can act as important reaction zones where price may reject.

Intraday targets
Higher-timeframe highs and lows can be used as potential target zones.

Market structure context
The indicator helps traders see where price is trading relative to important previous candle levels.

Short Marketplace-Style Version

Royal Liquidity is a multi-timeframe previous high and low indicator built to reveal key liquidity levels directly on your chart. It automatically plots the previous highs and lows from selected timeframes, including M5, M15, M30, H1, H4, H12, and D1.

Designed for liquidity-based traders, breakout traders, scalpers, and intraday traders, Royal Liquidity helps identify potential sweep zones, breakout areas, reversal levels, and profit targets with a clean visual layout.

Disclaimer

Royal Liquidity is a technical analysis tool and does not guarantee profitable trades. It should be used together with risk management, market structure analysis, and a complete trading plan.

สรุป

โปรไฟล์อินดิเคเตอร์
หมวดหมู่อินดิเคเตอร์
Trend
ประเภทเอาต์พุต
สัญญาณ
ข้อกำหนดด้านข้อมูล
ข้อมูล Tick
สัญญาณที่รองรับ
Breakout
Cross
เบรก Level ที่ระบุ
Reversal

การสนทนา

รีวิวจากลูกค้า

0.0
รีวิว: 0
รีวิวจากลูกค้า
ยังไม่มีรีวิวสำหรับผลิตภัณฑ์นี้ หากเคยลองแล้ว ขอเชิญมาเป็นคนแรกที่บอกคนอื่น!

คำถามที่พบบ่อย

Supertrend
Liquidity Sweep
Liquidity Grab
ผลิตภัณฑ์ที่มีให้บริการผ่าน cTrader Store รวมถึงบอทการเทรด อินดิเคเตอร์ และปลั๊กอิน มีให้บริการโดยนักพัฒนาบุคคลที่สามและมีไว้เพื่อวัตถุประสงค์ในการเข้าถึงข้อมูลและทางเทคนิคเท่านั้น cTrader Store ไม่ใช่โบรกเกอร์และไม่ได้ให้คำแนะนำการลงทุน คำแนะนำส่วนบุคคล หรือการรับประกันผลการดำเนินงานในอนาคต

เพิ่มเติมจากผู้เขียนคนนี้

อินดิเคเตอร์
AI
ATR
+27
SR Commander is a clean and intelligent support and resistance indicator for cTrader, built to help traders identify key
"Buy and sell indicator" โลโก้
ยอดนิยม
4.3
(3)
$19
/
$29
อินดิเคเตอร์
AI
ATR
+20
Buy and Sell Signals
อินดิเคเตอร์
AI
ATR
+27
WICK COMMANDER — Know Exactly When the Market Commits
"overbought oversold" โลโก้
ยอดนิยม
5.0
(3)
$19
/
$29
อินดิเคเตอร์
AI
ATR
+27
Overbought Oversold Indicator
อินดิเคเตอร์
AI
ATR
+20
Know Sure Thing (KST) momentum engine
อินดิเคเตอร์
AI
SMC
+5
Coloring trendline/ Colored Trendline / Color Trendline
อินดิเคเตอร์
AI
ATR
+27
VWAP Sniper Elite -- Institutional Trend Engine
"heatmap kopie" โลโก้
ยอดนิยม
4.2
(4)
$19
/
$29
อินดิเคเตอร์
AI
SMC
+13
Dynamic Liquidity Depth exposes hidden volume
อินดิเคเตอร์
AI
ATR
+26
Entry Momentum MACD Power Guide
อินดิเคเตอร์
AI
ATR
+27
The Professional “All-in-One” Trading Suite (buy and sell indicator)
อินดิเคเตอร์
AI
ATR
+26
SR Commander — Multi Timeframe Edition. See where the big money draws the line. Trade on your timeframe. Think on theirs
"crossover 1" โลโก้
เรตติ้งสูง
4.2
(5)
$19
/
$29
อินดิเคเตอร์
AI
Grid
+10
Crossover Buy and Sell Alerts and signals

นอกจากนี้คุณยังอาจชอบ

อินดิเคเตอร์
BOS
EMA
+5
VWAP Bands indicator with 3 standard deviation levels, buy/sell zones, and a draggable ON/OFF button to toggle the entir
อินดิเคเตอร์
Order Block
Breaker Block
+5
Unicorn Model ICT Indicator — Smart Trading with Precision
อินดิเคเตอร์
ATR
BOS
+5
Full ICT/SMC 4-step setup checker that alerts a long or short setup.
"Candles_Painter" โลโก้
ยอดนิยม
4.6
(3)
$19
อินดิเคเตอร์
Overlay HTF context on any chart: color bars by HTF and draw filled HTF bodies with optional High/Low lines.
อินดิเคเตอร์
Drawdown Monitor
Protect your funded account. Real-time Daily Equity Drawdown monitor with Green / Orange / Red flashing alerts.
อินดิเคเตอร์
Prop
Forex
+5
Higher TimeFrame Candle Tracker: Current Timeframe (Any TimeFrame) Show High TimeFrame Candle Bar
อินดิเคเตอร์
SMC
Prop
+14
BoS ChoCH Pro,Strict Mode,False Breakout Filter,Average hit rate: 72-78%
อินดิเคเตอร์
Shows daily and sessions highs / lows and session boxes, everything configurable
อินดิเคเตอร์
ATR
RSI
+6
Market structural patterns , specifically the concepts of Change of Character (ChoCH) 🔄 and Break of Structure (BoS) 💥
อินดิเคเตอร์
VWAP
Support & Resistance
Trading.FC$_vwap Algo shows VWAP trends, dynamic support/resistance and deviation bands to spot potential trade entries.
"MACD Histogram PRO" โลโก้
ยอดนิยม
4.3
(3)
$19
อินดิเคเตอร์
MACD
Prop
+14
Enhance MACD Histogram! Visualize bull and bear price changes with vibrant colors for clearer, more insightful trading.
"All Support and Resistance Levels" โลโก้
เรตติ้งสูง
4.2
(5)
$19
/
$20
อินดิเคเตอร์
RSI
Breakout
+1
"Identify key market zones and visualize support/resistance from multiple timeframes on a single chart.
อินดิเคเตอร์
ATR
EMA
+5
Candle timer with live profit tracking on chart – displays pips, currency value, and percentage in real time.
อินดิเคเตอร์
MACD
Prop
+8
NTNPICLL is a tool to check the best trading hours for the assets and also includes the highest and lowest point
"QX Heatmap Scanner" โลโก้
ยอดนิยม
4.3
(3)
$19
/
$38
อินดิเคเตอร์
ATR
RSI
+19
Multi-timeframe heatmap scoring Direction, Strength & Volatility at a glance!
อินดิเคเตอร์
ATR
Wedge
+2
Strong Supertrend Turn Market Movement into a Clear Map Market analysis
อินดิเคเตอร์
AI
SMC
+14
Refined cleaner version of Key Levels indicator with broker UTC offset, styles & label alignment.
"Trend Direction Force Index  - TDFI (Alerts)" โลโก้
เรตติ้งสูง
4.7
(7)
$19
อินดิเคเตอร์
Spot Strong Trends Early & Filter Market Noise

ราคา

86
การขาย
1.18K
ติดตั้งฟรี