
คำอธิบาย
Harmonic Strategy Suite Pro
ตัวบ่งชี้ฮาร์มอนิกส่วนใหญ่จะวาดรูปแบบและปล่อยให้คุณเดาว่ามัน
คุ้มค่าที่จะเทรดหรือไม่ เครื่องมือนี้ตอบคำถามนั้น: ทุกรูปแบบที่พบจะถูก
เล่นซ้ำกับประวัติของแผนภูมิเอง ดังนั้นคุณจะเห็นอัตราการถูกต้องจริงของแต่ละ
ประเภทรูปแบบบนเครื่องมือและกรอบเวลาที่คุณกำลังดูอยู่ - ก่อนที่คุณจะเสี่ยง
อะไรเลย
สิ่งที่มันวิเคราะห์
ตัวบ่งชี้ทำงานจากโครงสร้างราคาอย่างเดียว - ไม่มีตัวบ่งชี้ซ้อนทับ
บนตัวบ่งชี้อื่น ๆ และไม่มีการทาสีซ้ำของรูปแบบที่ยืนยันแล้ว
เครื่องยนต์ pivot ดั้งเดิมจะสแกนแผนภูมิผ่านช่วงความลึกของสวิงทั้งหมด
พร้อมกัน ดังนั้นมันจับโครงสร้างในหลายระดับแทนที่จะเป็นแค่ระดับเดียว
ที่การตั้งค่าของคุณชอบเท่านั้น pivots ที่ต่อเนื่องในทิศทางเดียวกันจะถูกรวม
ไปยังจุดสุดขีดที่แท้จริง ทำให้ได้ลำดับสูง-ต่ำ-สูงที่สลับกันอย่างชัดเจน
หน้าต่าง pivot ห้าจุดต่อเนื่องแต่ละชุด (X-A-B-C-D) จะถูกวัดเทียบกับ
คำจำกัดความ Fibonacci ที่เผยแพร่ของรูปแบบฮาร์มอนิกคลาสสิกหกแบบ:
Gartley B ที่ 0.618 ของ XA, D ที่ 0.786
Bat B ที่ 0.382-0.50, D ที่ 0.886
Butterfly B ที่ 0.786, D ที่ 1.272-1.618
Crab B ที่ 0.382-0.618, D ที่ 1.618
Shark B ที่ 1.13-1.618, D ที่ 0.886-1.13
Cypher B ที่ 0.382-0.618, C ที่ 1.272-1.414, D ที่ 0.786
การตั้งค่าความทนทานควบคุมว่าต้องตรงกับอัตราส่วนเหล่านั้นอย่างเคร่งครัดเพียงใด และแต่ละ
การตรวจจับจะได้รับคะแนน 0-100 โดยดูจากความใกล้เคียงกับอัตราส่วนที่เหมาะสม - ดังนั้น
Gartley แบบหนังสือเรียนจะถูกแยกแยะได้ชัดเจนจากแบบหลวม ๆ
ตัวทดสอบย้อนหลัง - สิ่งที่ทำให้แตกต่าง
นี่คือส่วนที่เครื่องมือฮาร์มอนิกส่วนใหญ่ไม่มี
สำหรับทุกรูปแบบที่พบ ตัวบ่งชี้จำลองการเทรดที่รูปแบบนั้นจะ
สร้างขึ้น:
- คำสั่งจำกัดจะถูกวางที่จุดเสร็จสิ้น D
- หากราคาถึงเป้าหมายหรือหยุดก่อนแตะ D การตั้งค่านั้นจะ
ถือว่าเป็นโมฆะและไม่เคยกลายเป็นการเทรด - เหมือนกับคำสั่งพักที่แท้จริง
จะถูกยกเลิก
- คำสั่งที่ไม่ได้รับการเติมจะหมดเวลาใน 15 แท่ง
- การเทรดที่เติมแล้วจะถูกติดตามทีละแท่งเพื่อดูว่าถึง
เป้าหมาย 1, เป้าหมาย 2 หรือหยุดก่อน
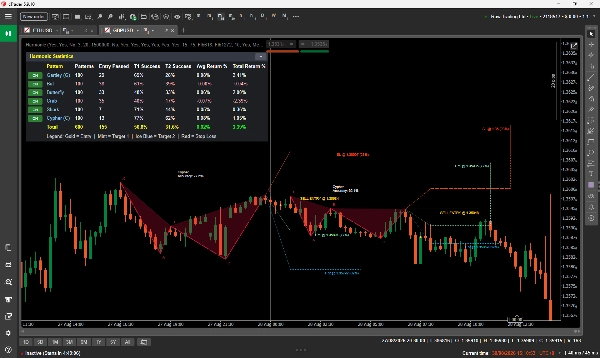
ผลลัพธ์เหล่านั้นถูกรวบรวมเป็นแดชบอร์ดบนแผนภูมิแสดง, ต่อประเภทรูปแบบ:
รูปแบบที่พบ | การเติมรายการเข้า | อัตราการถึงเป้าหมาย 1 | อัตราการถึงเป้าหมาย 2 |
ผลตอบแทนเฉลี่ย | ผลตอบแทนรวม
พร้อมแถวรวมทั้งหมด แถวที่ขาดทุนจะถูกเน้น และแต่ละประเภทรูปแบบ
มีปุ่มเปิด/ปิดที่กรองออกจากแผนภูมิทันที แผงจะยุบเป็นแถบหัวข้อเดียวเมื่อคุณต้องการมุมมองที่ชัดเจน
คุณสามารถเห็นได้ทันทีว่า ตัวอย่างเช่น Cypher เติมรายการน้อยแต่แปลงผลบ่อยในคู่สกุลเงินนี้
ในขณะที่ Crab เติมมากกว่าแต่แปลงผลน้อยกว่า นั่นคือการตัดสินใจที่คุณสามารถดำเนินการได้ - และมันถูกวัดจากข้อมูลของโบรกเกอร์คุณ ไม่ใช่
อ้างอิงจากหนังสือ
วิธีอ่านแผนภูมิ
แต่ละรูปแบบจะถูกวาดเป็นโครงกระดูก X-A-B-C-D พร้อมสามเหลี่ยมที่มีเงา
เงาไม่ใช่เพื่อความสวยงาม: ยิ่งรูปแบบนั้นถึงเป้าหมาย 1 ในการทดสอบย้อนหลังบ่อยเท่าไร
การเติมสีจะยิ่งทึบขึ้น โครงสร้างที่เชื่อถือได้จึงโดดเด่นทันที
แต่ละรูปแบบมีแผนการเทรดเต็มรูปแบบ:
เส้นเข้า สีทอง ป้ายชื่อ BUY ENTRY / SELL ENTRY พร้อมราคาที่แน่นอน
เป้าหมาย 1 สีมิ้นท์ ป้ายชื่อพร้อมราคากับอัตราการถึง T1 ของรูปแบบนั้น
เป้าหมาย 2 สีฟ้าน้ำแข็ง การจัดการเหมือนกัน
หยุดขาดทุน สีแดง
รูปแบบเส้นบอกสิ่งที่เกิดขึ้น ระดับที่ราคาถึงจริงจะถูกวาดเป็นเส้นทึบและหยุดที่แท่งที่ถูกตี ระดับที่ไม่เคยถึงจะเป็นเส้นประและลากไปจนจบการตั้งค่า จุดทองจะทำเครื่องหมายแท่งยืนยัน ป้ายชื่ออยู่ที่ปลายเส้นของตนเอง พร้อมเส้นนำเมื่อจำเป็นต้องเลื่อนเพื่อให้อ่านได้
ชื่อรูปแบบและความแม่นยำพิมพ์อยู่ข้างโครงสร้างแต่ละอัน วางไว้ใต้การตั้งค่าขาขึ้นและเหนือขาลงเพื่อไม่ให้ทับกับการเคลื่อนไหวของราคา
การตั้งค่าหลัก
รวมรูปแบบขาขึ้น / ขาลง ตัวกรองทิศทางการเทรด
เปิดใช้งาน Gartley ... เปิดใช้งาน Cypher ปิดใช้งานรูปแบบแต่ละอันทั้งหมด
ตัวค้นหา Pivot ความลึกขั้นต่ำ / สูงสุด ช่วงความไวสวิง (3-20) ค่าขั้นต่ำที่สูงกว่าจะพบโครงสร้างที่น้อยกว่าแต่ใหญ่กว่า
อัตราความผิดพลาดของ Fib ที่อนุญาต % ความทนทานอัตราส่วน ค่าเริ่มต้น 15% เป็นค่าที่สมดุล; ลดลงสำหรับการตรวจจับแบบหนังสือเรียนเท่านั้น
ระยะห่างหยุดขาดทุน การวางหยุดเกิน D เป็นเปอร์เซ็นต์ของช่วง AD
เป้าหมาย 1 / เป้าหมาย 2 อัตราส่วน ค่าคูณ Fibonacci ของ AD
แท่งประวัติที่จะสแกน ความลึกของการสแกนและตัวอย่างสถิติ
จำนวนรูปแบบสูงสุดที่จะวาด ความชัดเจนของแผนภูมิกับความสมบูรณ์
แสดงแดชบอร์ดสถิติ เปิด/ปิดแดชบอร์ด
สีและขนาดตัวอักษร ควบคุมภาพทั้งหมด
เหมาะสำหรับใคร
เหมาะสำหรับเทรดเดอร์ที่เข้าใจรูปแบบฮาร์มอนิกแล้วและต้องการให้งานหนักอัตโนมัติพร้อมหลักฐานแนบ - และสำหรับเทรดเดอร์ระดับกลางที่รู้จักรูปทรงแต่ไม่แน่ใจว่าจะเชื่อรูปแบบไหน
มันมีประโยชน์จริงสำหรับเทรดเดอร์สวิงและอินเทรดบนเครื่องมือและกรอบเวลาใดก็ได้: ฟอเร็กซ์ ดัชนี สินค้าโภคภัณฑ์ และคริปโตทั้งหมดใช้งานได้ เพราะตรรกะเป็นเรขาคณิตราคาแท้จริง
ถ้าคุณไม่เคยเจอรูปแบบฮาร์มอนิกมาก่อน โปรดอ่านพื้นฐานก่อน
ตัวบ่งชี้จะหามันให้คุณ แต่สมมติว่าคุณรู้ว่า Gartley กำลังพยายามบอกอะไรคุณ
การใช้งานทั่วไป
1. แนบกับแผนภูมิและปล่อยให้แดชบอร์ดสร้างตัวอย่างของมัน
2. ดูว่าประเภทรูปแบบใดทำงานจริงบนเครื่องมือและกรอบเวลานั้น และปิดใช้งานรูปแบบที่อ่อนแอ
3. รอการเสร็จสิ้นใหม่ที่ D ตรวจสอบคะแนนความแม่นยำและอัตราการถูกตีในประวัติของประเภทนั้น
4. ใช้เส้นเข้า หยุด และเป้าหมายที่วาดเป็นแผน โดยปรับขนาดตามความเสี่ยงของคุณเอง
หมายเหตุสำคัญ - โปรดอ่าน
- นี่คือเครื่องมือวิเคราะห์ ไม่ได้วาง แก้ไข หรือปิดคำสั่งใด ๆ
ไม่มีการเทรดอัตโนมัติและไม่เคยแตะต้องบัญชีของคุณ
- ผลงานในอดีตไม่ใช่การทำนาย แดชบอร์ดรายงานสิ่งที่รูปแบบเหล่านี้ทำในอดีตบนข้อมูลที่โหลดมา มันเป็นหลักฐานสำหรับการตัดสินใจ ไม่ใช่การรับประกันสำหรับครั้งถัดไป
- สถิติต้องการตัวอย่าง cTrader ให้แท่งที่แผนภูมิได้โหลดจริง ดังนั้นเลื่อนกลับไปโหลดประวัติก่อนตัดสินตัวเลข - ความแตกต่างระหว่างไม่กี่ร้อยแท่งกับหลายพันแท่งคือความแตกต่างระหว่างเสียงรบกวนกับตัวอย่างที่ใช้งานได้
- ผลตอบแทนจะแสดงเป็นเปอร์เซ็นต์ของราคา คู่ฟอเร็กซ์จะแสดงเปอร์เซ็นต์ที่น้อยกว่าดัชนีหรือสินค้าโภคภัณฑ์โดยธรรมชาติ; เปรียบเทียบกับสิ่งที่เหมือนกัน
- อัตราการเติมรายการเข้าโดยทั่วไปต่ำตามการออกแบบ หลายการตั้งค่าฮาร์มอนิกไม่เคยเติมเพราะราคาวิ่งหนีจาก D ก่อน ตัวบ่งชี้นับสิ่งเหล่านั้นอย่างซื่อสัตย์ว่าไม่ได้เติมแทนที่จะทำให้สถิติดูดีเกินจริง
- การสแกนลึกทำงานจริง หากคุณตั้งค่าแท่งประวัติสูงบนเครื่องช้าและเห็นการหยุดชั่วคราวในแต่ละแท่งใหม่ ให้ลดจำนวนแท่งประวัติที่จะสแกนหรือเพิ่มความลึก pivot ขั้นต่ำ
วิเคราะห์เท่านั้น ไม่มี DLLs ไม่มีการเชื่อมต่อภายนอก ไม่เคยส่ง แก้ไข หรือปิดคำสั่ง
สรุป
A key feature is its integrated backtester, which simulates trades for each pattern found on the chart’s historical data. It places hypothetical limit orders at pattern completion points (D), tracks whether targets or stops are hit, and accounts for unfilled orders and invalidated setups. Results are summarized in an on-chart dashboard showing statistics such as patterns found, entries filled, hit rates for two targets, average and total returns per pattern type, with options to filter patterns on or off.
Patterns are visually displayed with their X-A-B-C-D structure, trade entry, stop loss, and target levels, using line styles and shading to indicate historical success rates and trade outcomes. The indicator supports customization of pattern inclusion, pivot sensitivity, Fibonacci ratio tolerance, stop and target distances, and visual settings.
Designed for traders familiar with harmonic patterns, it suits swing and intraday trading across instruments and timeframes including forex, indices, commodities, and crypto. It functions solely as an analysis tool without order execution capabilities.

















