Forex piyasalarında biraz zaman geçirdiyseniz, özellikle birden fazla pariteye bakarken, hangi para biriminin gerçekten hareketi yönlendirdiğini anlamanın ne kadar zor olabileceğini bilirsiniz. Sıklıkla, sadece bir paritenin nasıl davrandığını değil, büyük para birimlerinin bireysel performansını daha net görmenin bir yolunu istiyordum.
Bu yüzden Göreceli Para Birimi Gücü göstergesini geliştirdim.
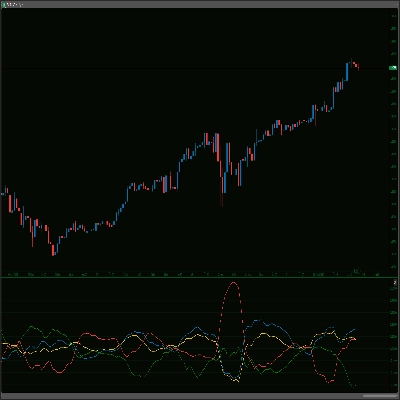
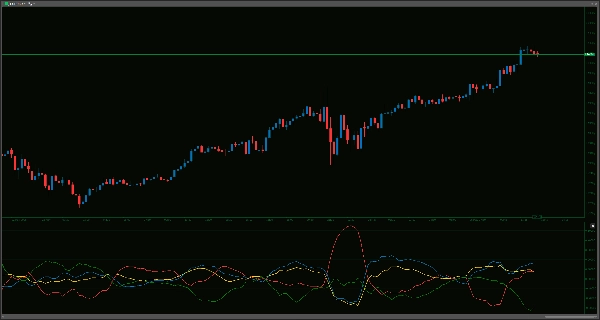
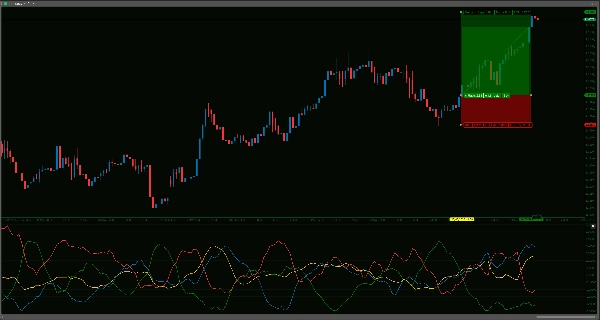
Fikir oldukça basit: AUD, USD, EUR ve JPY'nin göreceli gücünü ölçmeyi ve göstermeyi amaçlar. Bunu, bu para birimlerinin her birinin diğerlerinin bir sepetine karşı (özellikle AUDUSD, AUDEUR, AUDJPY, EURUSD, EURJPY ve USDJPY gibi pariteler üzerinden) belirleyebileceğiniz bir geriye dönük dönem boyunca nasıl performans gösterdiğine bakarak yapar.
Bana nasıl yardımcı olduğunu ve size nasıl yardımcı olabileceğini:
- Daha İyi Parite Seçimi: Örneğin, AUD'nin sürekli güçlendiğini ve JPY'nin zayıfladığını görmek, AUD/JPY'ye daha yakından bakmanız için size bir işaret verebilir. Odaklandığınız pariteleri filtrelemenize yardımcı olabilir.
- Piyasa Sürücülerini Anlama: EUR/USD gibi bir parite hareket ettiğinde, bu çoğunlukla USD gücü mü yoksa EUR zayıflığı mı? Bu gösterge size bu konuda bir perspektif sunabilir ve daha geniş akışı anlamanıza yardımcı olabilir.
- Tarzınıza Uygun Hale Getirin:
-
- Varsayılan olarak 14 bar olan
LookbackPeriodayarını değiştirebilirsiniz. Daha kısa bir dönem daha duyarlı olurken, daha uzun bir dönem daha yerleşik trendleri gösterecektir. - Ayrıca, güç çizgilerine EMA uygulayan varsayılan olarak 5 bar olan
SmoothingPeriodvardır. Daha pürüzsüz bir çıktı tercih ediyorsanız, bu bazı gürültüyü azaltmaya yardımcı olabilir. Ham hesaplamayı istiyorsanız, smoothing değerini 0 yapmanız yeterlidir.
- Varsayılan olarak 14 bar olan
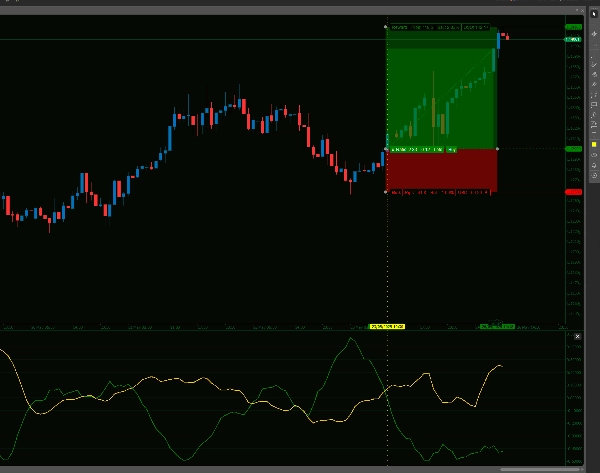
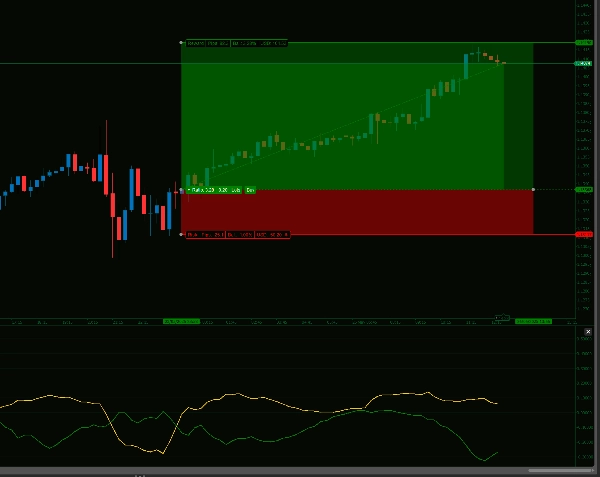
- Net Görseller: Her para biriminin gücünü ana grafiğinizin altında ayrı bir pencerede ayrı bir çizgi olarak çizer, böylece fiyat hareketinizi karıştırmaz.
- Güvenilir Veri: Hesaplamalar her barın kapanışında yapılır, bu yüzden bar tamamlandıktan sonra çizgiler yeniden çizilmez veya değişmez.
Hiçbir gösterge kristal küre değildir ve bu da farklı değildir. Bu bir araçtır. Özellikle fikirleri doğrulamak veya büyük para birimlerinin ne yaptığını hızlıca görmek için analiz sürecimin faydalı bir parçası olduğunu gördüm.
Dikkat edin, bu gösterge gerçek göreceli gücü etkili bir şekilde hesaplamak için tüm döviz çiftlerinden veri çektiğinden, diğer kaynak yoğun göstergeleriniz varsa bu gösterge kaynak kullanımı açısından ağır olabilir ve bazen Ctrader'ın çökmesine neden olabilir. Geçen ay 5 yıllık PC'mde bir kez böyle bir durum yaşadım, bu yüzden düzenli olarak olmamalı. Ama olursa, pencere zaman dilimini basitçe yenilemek veya dönem ayarlarını +/-1 değiştirerek yeniden hesaplama yapılmasını sağlamak ve göstergenin tekrar görünmesini sağlamak yeterlidir.
--------------------------
Lütfen diğer göstergelerime de göz atmayı unutmayın!
https://ctrader.com/products/1181
https://ctrader.com/products/1182
https://ctrader.com/products/1180
https://ctrader.com/products/1015
https://ctrader.com/products/555
https://ctrader.com/products/553
https://ctrader.com/products/554
https://ctrader.com/products/552
https://ctrader.com/products/557
https://ctrader.com/products/845
https://ctrader.com/products/848
https://ctrader.com/products/847
https://ctrader.com/products/846
https://ctrader.com/products/551
https://ctrader.com/products/574
https://ctrader.com/products/573
https://ctrader.com/products/556
https://ctrader.com/products/558
5 | 67 % | |
4 | 33 % | |
3 | 0 % | |
2 | 0 % | |
1 | 0 % |


