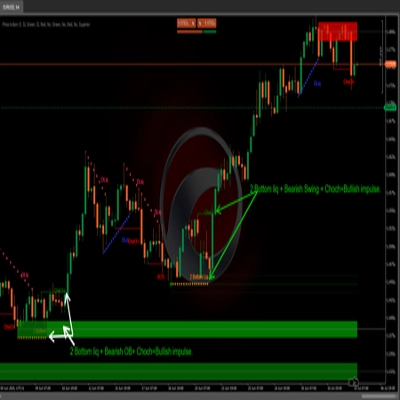
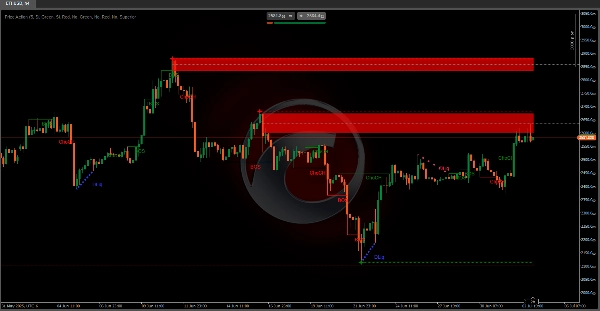
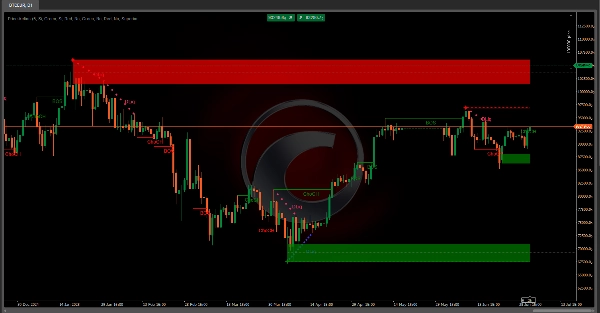
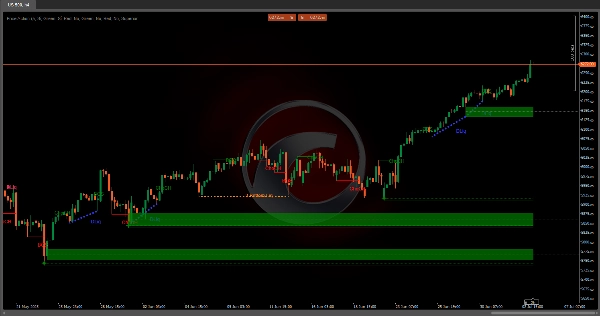
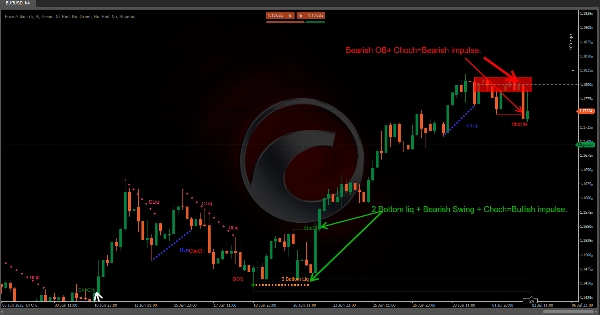
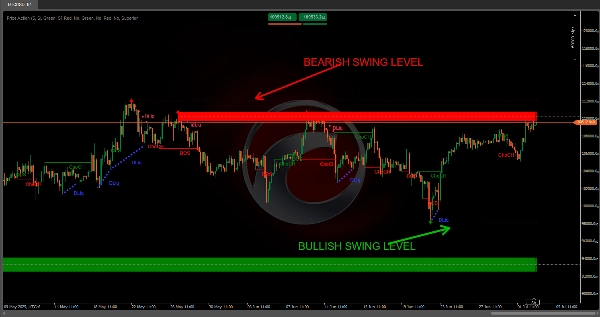
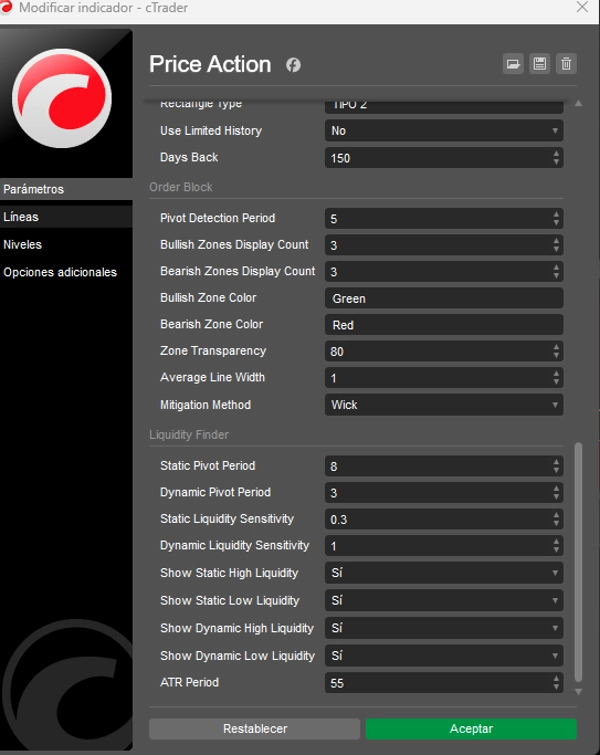
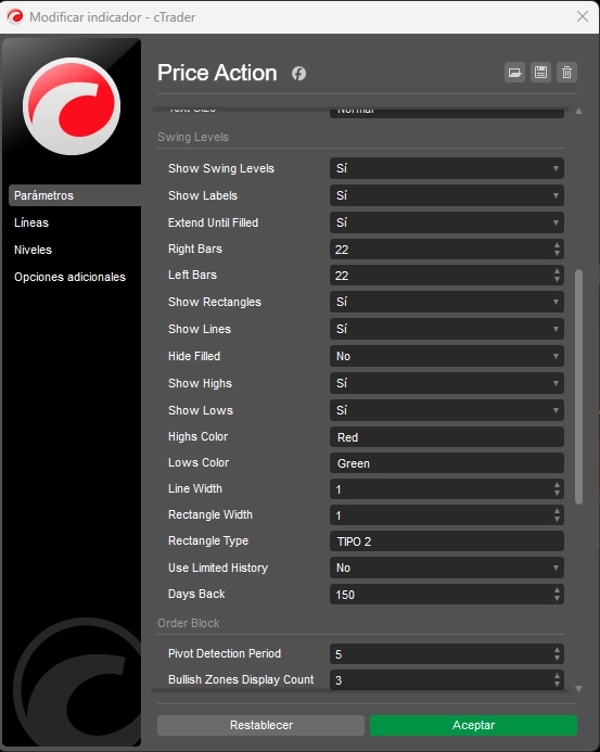
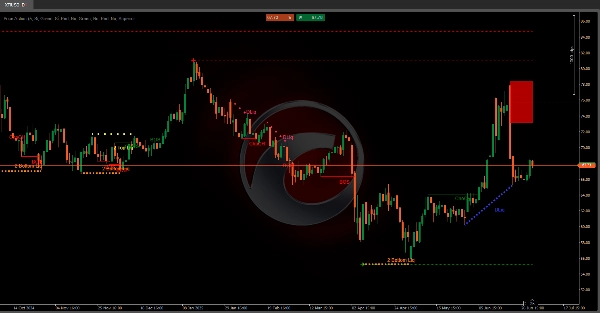
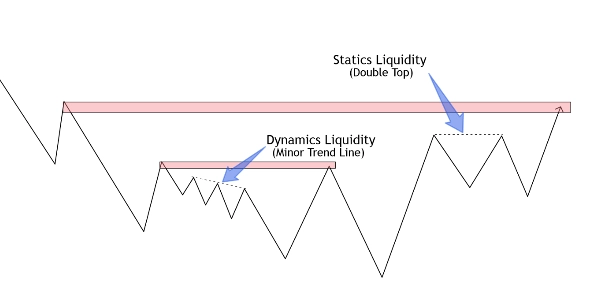
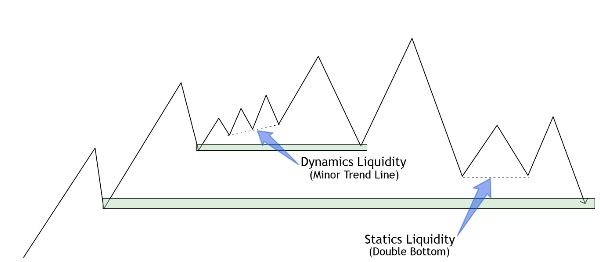
Price Action
Indicador
Versión 1.0, Jul 2025
Windows, Mac
Imagen cargada de "Price Action"Imagen cargada de "Price Action"Imagen cargada de "Price Action"Imagen cargada de "Price Action"Imagen cargada de "Price Action"Imagen cargada de "Price Action"Imagen cargada de "Price Action"Imagen cargada de "Price Action"Imagen cargada de "Price Action"Imagen cargada de "Price Action"
Desde 03/10/2024
142
Ventas
31.16K
Instalaciones gratis
Indicator profile
0.0
Valoraciones: 0
Valoraciones de clientes
Este producto todavía no se ha valorado. ¿Ya lo ha probado? Sea el primero en informar a otros.
Products available through cTrader Store, including indicators, plugins and cBots, are provided by third-party developers and made available for informational and technical access purposes only. cTrader Store is not a broker and does not provide investment advice, personal recommendations or any guarantee of future performance.

Más de este autor

Logotipo de "ZigZag"
Mejor valorado
4.3
(6)
Gratis
Indicador
RSI
XAUUSD
+7
ZigZag filters noise, spots trends, patterns, pivots, aiding analysis, trade management, and confirmations. 📉📈
Indicador
RSI
XAUUSD
+7
Identify bullish and bearish Order Blocks to spot key support/resistance levels and potential trend reversals! 📈🔄
Indicador
RSI
Breakout
+7
📊 Shows volume by price levels, highlights POC, and key zones. Identifies dynamic support/resistance and imbalances.
Indicador
RSI
XAUUSD
+6
Market structural patterns , specifically the concepts of Change of Character (ChoCH) 🔄 and Break of Structure (BoS) 💥
Indicador
RSI
Breakout
+6
Adaptive trend channel using linear regression and Pearson correlation for dynamic support, resistance, and trends.
Indicador
RSI
Breakout
+1
"Identify key market zones and visualize support/resistance from multiple timeframes on a single chart.
Indicador
RSI
Breakout
+6
📊Zones Supply & Demand: Identifies key price levels with high volume concentration, marking Supply/Demand Zones & Marke
Indicador
RSI
Breakout
+6
💹 Define a price channel 📈 and determine trend direction (bullish 🟢 or bearish 🔴).
Indicador
RSI
Breakout
+7
identify and highlight temporary market inefficiencies known as "fair value gaps" 🚨 within specific trading Sessions.
Indicador
RSI
Breakout
+5
Identify market structure effortlessly with swing highs, lows, CHoCH, and BOS levels for smart trading decisions! 📊🔍"
Indicador
Indices
RSI
+8
Detects bullish and bearish divergences
Indicador
RSI
Breakout
+1
📊 Liquidation Map: Potential areas where highly leveraged investors might face liquidations.

Puede interesarle

Indicador
NAS100
RSI
+15
Identifies high-probability breakout and retest zones using smart pivot structure and volatility filtering.
Indicador
Grid
NAS100
+18
Golden Candle Fib By Wejoy
Indicador
Grid
NAS100
+18
ICT First Presented FVG
Indicador
Grid
NAS100
+18
Smart Money Concepts (SMC)
Indicador
NAS100
NZDUSD
+12
First Presented Fair Value Gap (FPFVG)
Indicador
NAS100
NZDUSD
+12
Killzone, ICT, SMC, Session, Asia, London, New York, NY PM, Session High, Session Low, Smart Money, Order Flow, Trading
Indicador
Indices
XAUUSD
+6
Automatically draws the Opening Range (High & Low) for Tokyo, London, and New York sessions. Configurable start times,
Indicador
NAS100
NZDUSD
+12
Sessions [BeyondTrading] Sessions allow you to know where every session ranged. Spot the levels institutions target.
Indicador
NAS100
NZDUSD
+11
Advanced EMA indicator with dynamic color trend, slope strength & smart filters for clean, high-probability trading sign
Indicador
NAS100
NZDUSD
+11
Order Flow Market Depth Pro | Footprint & DOM
Indicador
NAS100
NZDUSD
+12
Pro Structure Patterns Detector
Indicador
NAS100
XAUUSD
+5
MAMA/FAMA centerline with elastic energy bands and snap-back reversal signals. Adaptive width. Built-in panel.
Desde 03/10/2024
142
Ventas
31.16K
Instalaciones gratis