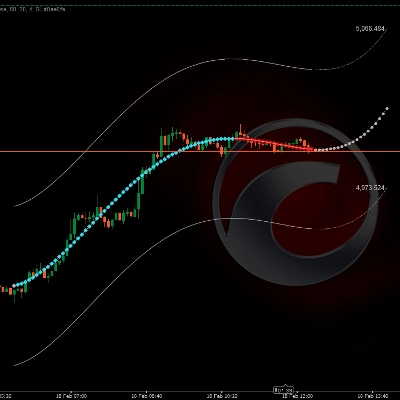
📊 Polynomialer Preisprojektion-Kanal
https://chartshots.spotware.com/c/699603101593d
🔎 WAS MACHT ES?
https://chartshots.spotware.com/c/69960348da652
Passt eine mathematische Kurve über die letzten N Schlusskurse an und erstreckt sie in die Zukunft als Projektion. Um diese Kurve herum zeichnet es einen oberen und unteren Kanal deren Breite sich automatisch an die jüngste Marktvolatilität anpasst.
⚙️ WIE FUNKTIONIERT DIE LOGIK?
- Nimmt die letzten N Kerzen (Lookback Bars) und berechnet die Polynomkurve, die am besten zu diesen Preisen mit der Methode der kleinsten Quadrate passt.
- Erstreckt die Kurve nach vorne (Forecast Bars) als mathematische Projektion des aktuellen Trends.
- Erstellt den Kanal indem die Kurve nach oben und unten verschoben wird unter Verwendung der maximalen Kerzenspanne des analysierten Zeitraums × 2.
https://chartshots.spotware.com/c/6996039a07e3a
🛠️ WICHTIGE PARAMETER
Parameter
Standard
Zweck
Lookback Bars
80
Wie viele historische Kerzen analysiert werden
Forecast Bars
20
Wie viele Kerzen in die Zukunft projiziert werden
Polynomgrad
4
Kurvenflexibilität (höher = mehr Kurven)
Dateninput
Schlusskurs
Basispreis für die Berechnung
🎯 WIE BENUTZT MAN ES?
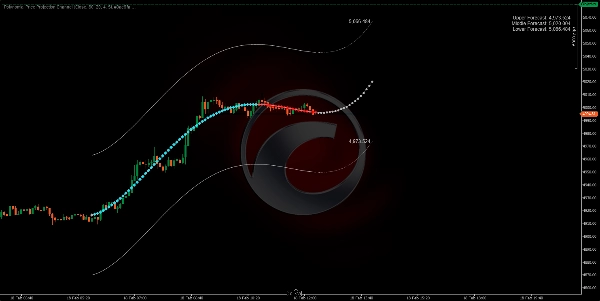
🟢 Potentieller Kauf → Der Preis berührt das untere Band und die Projektion zeigt nach oben.
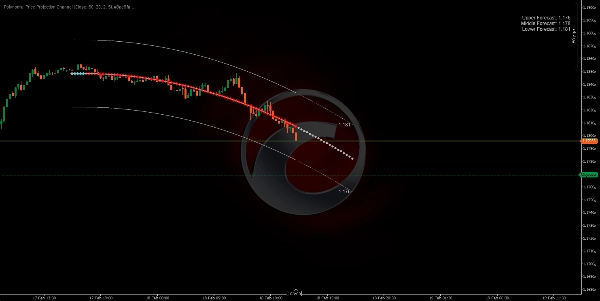
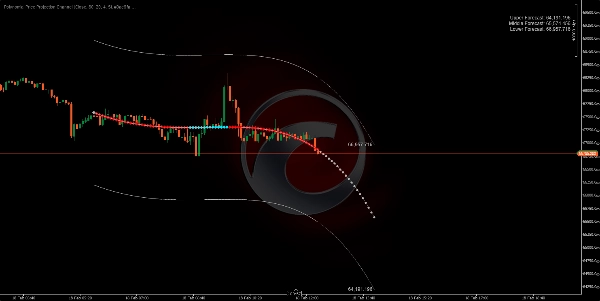
🔴 Potentieller Verkauf → Der Preis berührt das obere Band und die Projektion zeigt nach unten.
⚠️ Immer bestätigen mit anderen Faktoren vor dem Handel. Dieser Indikator ist eine mathematische Extrapolation, keine garantierte Vorhersage.
5 | 0 % | |
4 | 100 % | |
3 | 0 % | |
2 | 0 % | |
1 | 0 % |


