"Trading Pro Market" 标识
指标
版本 1.0, Apr 2026
Windows 版、Mac 版
4.0
评价:1
"Trading Pro Market" 已上传图片
注册日期 03/10/2024
151
销售
34.84K
免费安装

📊 Trading Pro Market

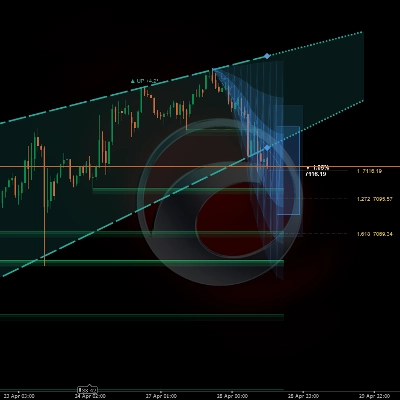
https://chartshots.spotware.com/c/69f0ec41d4cfc

趋势通道 + 价格预测 + 自动支撑和阻力区域 — 全部集成在一个叠加指标中

🔍 它是什么?

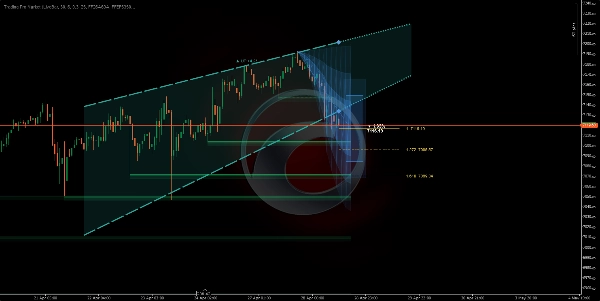
https://chartshots.spotware.com/c/69f0ec1fa9930

Trading Pro Market 是一个先进的技术分析指标,将三个独立引擎合并为一个工具:带有前瞻投影的趋势通道、基于历史运动模式的价格预测系统,以及自动支撑和阻力区域检测器。所有内容直接绘制在价格图表上 — 无需单独面板。

📐 模块 1 →ICP 通道🔮 模块 2 → MFP 预测 🧲 模块 3 → 支撑/阻力区域

https://chartshots.spotware.com/c/69f0ec8faa957

📐 模块 1 — 趋势通道 (ICP)

⚙️ 它如何检测趋势?

该指标将可见的K线分割成时间块(默认:每块30根K线,总共6块)。在每个时间块内,使用对数价格刻度计算最高价和最低价之间的几何中点。然后连接这些时间块中的中点,以确定价格是上涨、下跌还是横盘。

连接线的斜率被转换为以度数表示的角度。如果角度低于配置的阈值(默认0.3°),市场被归类为盘整。超过该阈值,指标则赋予看涨或看跌方向。

💡 波动率使用杨-张估算器测量 — 这是一种利用开盘价、收盘价、最高价和最低价计算真实市场波动率的统计公式。该数值对角度进行归一化,使通道在任何资产或时间框架下表现一致。
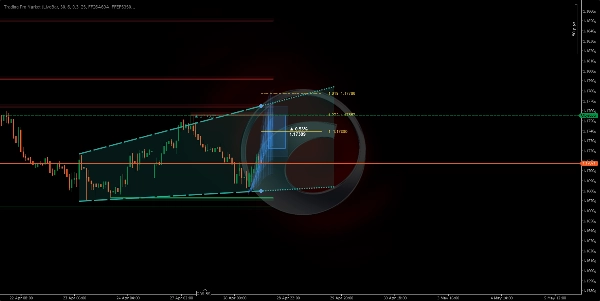
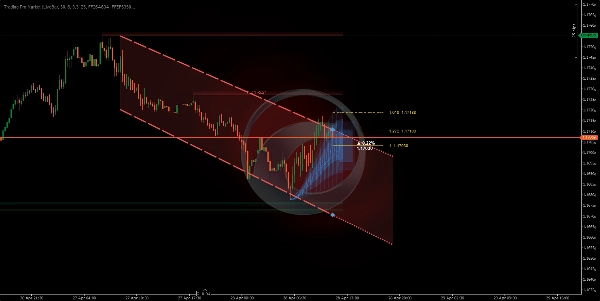
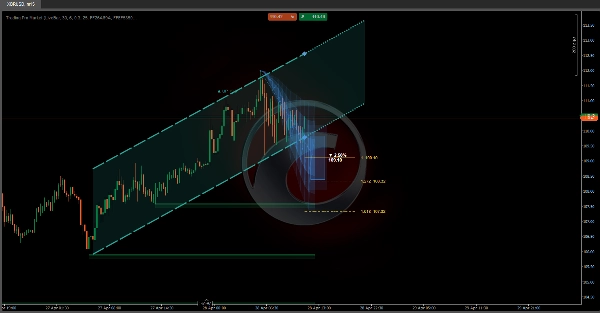
🎨 它在图表上绘制什么?

它绘制两条线形成通道(顶部和底部),并在它们之间填充阴影区域。右侧,通道以点状线延伸,跟随当前斜率。颜色根据方向自动变化:

🟢 绿色 — 看涨趋势🔴 红色 — 看跌趋势⬜ 灰色 — 盘整市场

🔁 状态机 — 价格在通道中的位置?

指标实时跟踪收盘价相对于通道边界的位置,并将情况分类为五种不同状态:

🟦 内部→⚡ 突破→📏 远离→↩️ 复测→✅ 确认


每个状态在图表的信息面板上以纯文本描述,同时显示当前价格与通道顶部或底部的百分比距离。

🔮 模块 2 — 运动预测 (MFP)

⚙️ 它如何生成预测?

引擎通过回溯可配置数量的K线,检测重要的价格转折点(局部高点和低点)。每个确认的转折点记录两个数据点:完成的价格移动百分比和所用的K线数量。最多存储20个历史移动,预期的下一步移动通过以下三种方法之一计算:

⚖️ 加权 — 最近的移动权重更大➕ 简单平均 — 所有移动权重相等📊 中位数 — 过滤异常值

🎨 它在图表上绘制什么?

基于当前转折点起点,未来投影三个可选视觉元素:

1

🔵 投影区: 三层递减透明度,展示可能的移动范围。锥形越宽,基于历史方差的不确定性越大。

2

🎯 目标框: 一个矩形,放置在估计的目标价格处,标注预期的百分比移动和精确价格水平。

3

📏 斐波那契水平: 从起点到终点投影的水平线,使用可配置比率(默认:1.0, 1.272,和 1.618)。

⚠️ 预测不代表未来。它是过去类似移动的统计平均值。其价值在于设定对幅度和持续时间的现实预期 — 而非作为独立的进出场信号。

🧲 模块 3 — 支撑和阻力区域

⚙️ 它如何检测区域?

每当确认一个转折点,指标使用ATR(平均真实波幅)绘制一个水平区域以确定区域厚度。阻力区域用红色绘制,支撑区域用绿色绘制 — 两者均有两层透明度以增强视觉深度和清晰度。

区域动态变化:如果价格收盘于区域另一侧,该区域标记为“已突破” — 切换为透明度降低的点状线。区域在“区域寿命”配置的K线数后自动消失。

🚀 如何使用

1

确认趋势: 查看通道颜色和方向。角度(度数)显示趋势强度 — 角度越陡,动能越强。

2

读取价格状态: 图表信息面板实时描述价格是在通道内、突破还是复测通道边界。

3

评估预测: 锥形和目标框提供参考,基于会话中积累的历史模式库,显示价格可能移动的位置和距离。

4

尊重区域: 未突破的支撑/阻力框标记市场之前反应的价格水平。未被突破的区域比已突破的更具重要性。

🖥️ 兼容性和要求

✅ cTrader✅ cAlgo API✅ 任何资产✅ 任何时间框架✅ 价格叠加

无需互联网访问或特殊权限。所有计算均在本地使用平台已有的价格数据完成。

⏱️ 为获得最佳效果,请在15分钟及以上时间框架使用。在非常低的时间框架(1–5分钟)中,市场噪音可能产生统计可靠性较低的转折点,降低支撑/阻力区域和预测的质量。

指标配置
指标分类
市场结构(SMC)
输出类型
可视化
信号
数据要求
仅 K 线
支持的信号
突破
趋势强度
突破水平位
触及水平位
4.0
评价:1
5
0 %
4
100 %
3
0 %
2
0 %
1
0 %
客户评价
May 11, 2026
1.5R target is the line to watch. The trade idea gets a pause before execution.
Key Levels
Channel
Support & Resistance
cTrader Store 提供的所有产品,包括交易机器人、指标和插件,均由第三方开发者提供,仅供信息参考和技术访问之用。cTrader Store 并非经纪商,不提供投资建议、个人推荐或任何未来业绩保证。

该作者的其他作品

"ZigZag" 标识
评分最高
4.3
(6)
免费
指标
ATR
RSI
+7
ZigZag filters noise, spots trends, patterns, pivots, aiding analysis, trade management, and confirmations. 📉📈
指标
ATR
RSI
+7
Identify bullish and bearish Order Blocks to spot key support/resistance levels and potential trend reversals! 📈🔄
指标
ATR
RSI
+7
📊 Shows volume by price levels, highlights POC, and key zones. Identifies dynamic support/resistance and imbalances.
指标
ATR
RSI
+6
Market structural patterns , specifically the concepts of Change of Character (ChoCH) 🔄 and Break of Structure (BoS) 💥
指标
ATR
RSI
+6
Adaptive trend channel using linear regression and Pearson correlation for dynamic support, resistance, and trends.
指标
RSI
Breakout
+1
"Identify key market zones and visualize support/resistance from multiple timeframes on a single chart.
指标
ATR
RSI
+7
identify and highlight temporary market inefficiencies known as "fair value gaps" 🚨 within specific trading Sessions.
指标
ATR
RSI
+6
💹 Define a price channel 📈 and determine trend direction (bullish 🟢 or bearish 🔴).
指标
ATR
RSI
+6
📊Zones Supply & Demand: Identifies key price levels with high volume concentration, marking Supply/Demand Zones & Marke
指标
RSI
BTCUSD
+5
Identify market structure effortlessly with swing highs, lows, CHoCH, and BOS levels for smart trading decisions! 📊🔍"
指标
ATR
RSI
+8
Detects bullish and bearish divergences
指标
Advanced price action tool that combines multiple technical analysis concepts

猜您喜欢

指标
EMA
MACD
+5
Multi-timeframe MACD with color-changing line, 4-color histogram & triangle signals.
指标
The Multi-Timeframe Candle Indicator displays candles from multiple timeframes in one window, enhancing market analysis!
指标
Moving Average
An Indicator made for scalping. Shows you the Sniper movement on Chart with the colour signals.
指标
AI
ATR
+26
SMC without the mess: Clean structure + auto-managing FVGs + MTF panel. Hard-right-edge, step size-based for any symbol.
指标
Forex
The cTrader Market Sessions Alerts Indicator marks global sessions, highlights key levels, and sends real-time alerts.
指标
ATR
Prop
+14
Optimize exits with Chandelier Exit! Visualize stop-loss points dynamically for improved trading precision and safety.
指标
Grid
Prop
+14
Visualize trends with Standard Deviation Channel! Display median, and add customizable upper/lower deviation channels.
指标
ATR
Volume
+5
RANGER — Multi-Timeframe Trend & Signal Indicator
指标
SMC
Forex
+5
Pinpoint FVGs, track fills and see mitigation stats — trade imbalances with clarity and confidence.
指标
Advanced customizable volume-profile indicator with buy/sell levels, delta analysis, multi-TF support and vivid gradient
指标
Prop
Forex
+4
Risk Reward Management Tools(风险回报管理工具)
指标
RSI
MACD
+5
An advanced indicator merging Smart Money Concepts, Gann Sq9 targets, Monte Carlo analysis, and MTF trend bias.
指标
ATR
Volume
+2
Heatmap Liquidity Zones Visualize volume-at-price, uncover hidden support/resistance, and track market liquidity in real
指标
VWAP
Volume
+2
VWAP Bands and Swing Wick Structure Indicator
指标
Aggressive
Supertrend
+5
Stop trading with tunnel vision! 🚫 The Heat Map Dashboard is an institutional-grade visual trading assistant
指标
VWAP
Volume
+3
Track hidden trading activities to be on the right side of the market.
指标
Prop
Forex
+6
The Parabolic SAR, or "Stop and Reverse," is a dynamic technical analysis tool.
"Initial Balance" 标识
评分最高
4.5
(2)
免费
指标
Breakout
Fibonacci
Track Initial Balance ranges across any period with optional Fibonacci levels and projections.
注册日期 03/10/2024
151
销售
34.84K
免费安装