Mô tả
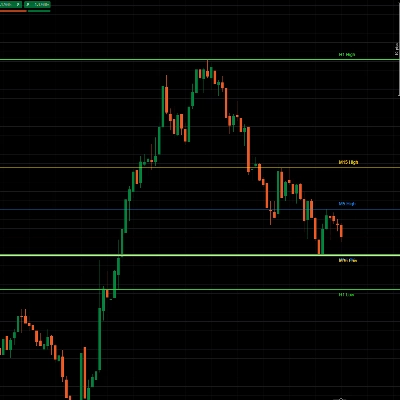
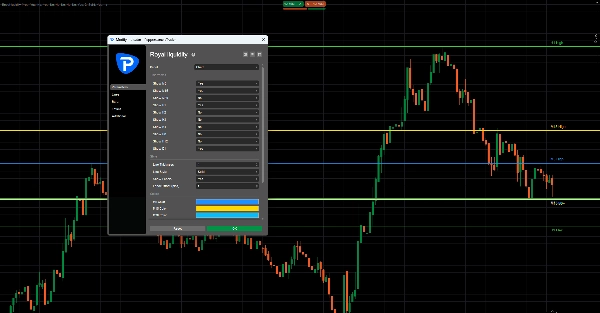
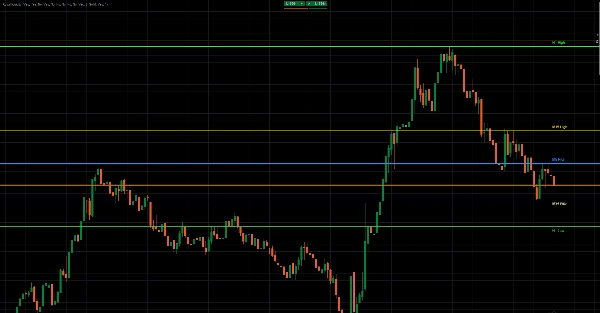
Royal Liquidity X is a clean and powerful multi-timeframe liquidity level indicator designed to display the previous high and previous low from multiple key timeframes directly on the chart.
The indicator helps traders quickly identify important liquidity zones where price may react, sweep liquidity, reject, break out, or continue with momentum. By plotting previous highs and lows from timeframes such as M5, M15, M30, H1, H2, H3, H4, H8, H12, and D1, Royal Liquidity gives traders a clear overview of the most relevant intraday and higher-timeframe liquidity levels.
These previous highs and lows are often watched by traders because they can act as potential stop-loss zones, breakout areas, reversal points, or price magnets. Royal Liquidity makes these levels visible automatically, without the need to manually draw them every session.
How It Works
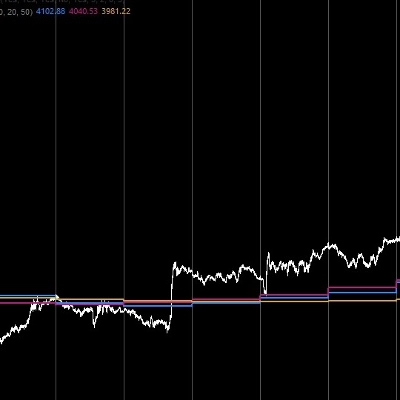
Royal Liquidity reads the most recently closed candle from each selected timeframe. For every enabled timeframe, it takes the previous candle’s high and low and plots them as horizontal levels on the active chart.
For example:
M15 High = High of the last closed M15 candleM15 Low = Low of the last closed M15 candleH1 High = High of the last closed H1 candleH1 Low = Low of the last closed H1 candleD1 High = High of the last closed daily candleD1 Low = Low of the last closed daily candle
The indicator updates only on the latest chart bar, keeping the chart efficient and lightweight. Each timeframe can be turned on or off individually, and every level can have its own custom color. Traders can also adjust line thickness, line style, labels, and label offset.
What It Shows
Royal Liquidity can display:
Previous M5 High / LowPrevious M15 High / LowPrevious M30 High / LowPrevious H1 High / LowPrevious H2 High / LowPrevious H3 High / LowPrevious H4 High / LowPrevious H8 High / LowPrevious H12 High / LowPrevious D1 High / Low
Each level is drawn as a horizontal line, with optional labels such as M15 High, M15 Low, H1 High, H1 Low, and D1 High / Low.
Trading Use Cases
Royal Liquidity can help traders identify:
Liquidity sweeps
Price may move above a previous high or below a previous low to collect liquidity before reversing.
Breakout zones
A strong break above a previous high or below a previous low can signal continuation or momentum.
Reversal areas
Previous highs and lows can act as important reaction zones where price may reject.
Intraday targets
Higher-timeframe highs and lows can be used as potential target zones.
Market structure context
The indicator helps traders see where price is trading relative to important previous candle levels.
Short Marketplace-Style Version
Royal Liquidity is a multi-timeframe previous high and low indicator built to reveal key liquidity levels directly on your chart. It automatically plots the previous highs and lows from selected timeframes, including M5, M15, M30, H1, H4, H12, and D1.
Designed for liquidity-based traders, breakout traders, scalpers, and intraday traders, Royal Liquidity helps identify potential sweep zones, breakout areas, reversal levels, and profit targets with a clean visual layout.
Disclaimer
Royal Liquidity is a technical analysis tool and does not guarantee profitable trades. It should be used together with risk management, market structure analysis, and a complete trading plan.