
Price Projection Swing Volume
مؤشر
324 التنزيلات
الإصدار 1.0، Feb 2026
Windows, Mac
الوصف
🚀حجم تقلب توقع السعر: 📈
https://chartshots.spotware.com/c/6980f0f0287fb
إن حجم تقلب توقع السعر هو أداة تنبؤ متقدمة مصممة لرسم المسار المستقبلي الأكثر احتمالاً لأصل ما بناءً على تقلبات السعر الأخيرة ونسب فيبوناتشي التناغمية. تحدد نطاق السوق الحالي وتعرض "خريطة طريق" متعددة المراحل لحركة السعر المحتملة.
🔍 تحليل السوق والظروف
https://chartshots.spotware.com/c/6980f104dab21
يركز هذا الخوارزم على تحديد "غلاف السوق" من خلال تحليل:
- نقاط التقلب القصوى: يقوم بفحص فترة النظر للخلف المحددة (مثلاً، آخر 50 شريطًا) للعثور على أعلى ارتفاع وأدنى انخفاض مطلق.
- مناطق التصحيح: يحسب ويرسم تلقائيًا خمسة مستويات رئيسية من فيبوناتشي (23.6٪، 38.2٪، 50٪، 61.8٪، و78.6٪) داخل التقلب الحالي لتحديد مناطق الاهتمام.
- التوقعات التناغمية: باستخدام نسبة التوقع (الافتراضية 0.618)، يحسب الخوارزم مسارًا مستقبليًا مكونًا من ثلاثة أجزاء بناءً على الحركات المقاسة من نقطة التقلب الأخيرة.
🟢 كيفية تفسير الإشارات والمرئيات
https://chartshots.spotware.com/c/6980f126d875a
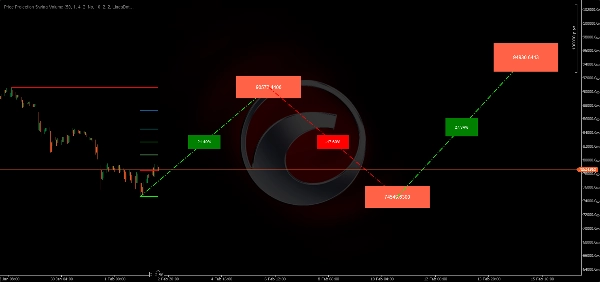
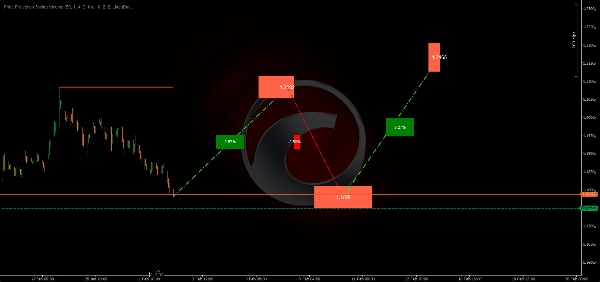
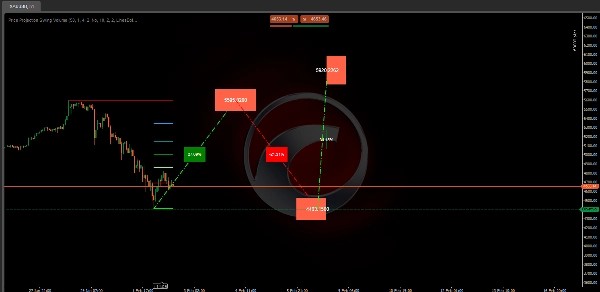
- خطوط التقلب الأفقية: تمثل الخطوط السميكة الحمراء (العالية) والخضراء (المنخفضة) الحدود الحالية للسوق. غالبًا ما يشير كسر السعر لهذه الخطوط إلى تغير في الاتجاه.
- مسار التوقع (الخطوط المنقطة): تتنبأ الخطوط المائلة بحركة "زجزاج". هذا هو توقع الخوارزم لكيفية تحرك السعر للوصول إلى هدفه النهائي.
- تسميات النسبة المئوية: تقع على الخطوط المائلة، وتظهر النسبة المئوية المتوقعة للربح أو الخسارة لتلك القطعة المحددة من الحركة.
- مربعات سعر الهدف: توفر المربعات الملونة في نهاية كل قطعة المستوى السعري الدقيق الذي يستهدفه الخوارزم.
⚙️ الإعدادات والمعلمات الرئيسية
- فترة النظر للخلف (50): تحدد مقياس التقلبات. الرقم الأعلى يبحث عن تقلبات "كبرى"، بينما الرقم الأقل يركز على تقلبات "صغرى" للتداول السريع.
- نسبة التوقع (0.618): تحدد هذه "النسبة الذهبية" عمق وارتفاع الزجزاجات المتوقعة. يمكنك تعديلها لأهداف أكثر أو أقل عدوانية.
- التخصيص البصري: ألوان قابلة للتعديل بالكامل للتوقعات الصاعدة/الهابطة ومستويات فيبوناتشي المحددة لتتناسب مع موضوع الرسم البياني الخاص بك.
🚀 حالات الاستخدام والسيناريوهات النموذجية
- تعيين الهدف: استخدم مربعات السعر المتوقعة لتحديد مستويات جني الأرباح لصفقات التقلب.
- توقع الانعكاسات: إذا أظهر التوقع تصحيحًا عميقًا قبل حركة صعودية، يمكن للمتداولين الانتظار حتى يصل السعر إلى خط "الوادي" المنقط قبل الدخول.
- الحركات المقاسة: ممتاز للمتداولين الذين يتبعون أنماط "ABCD" أو حركة السعر التناغمية.
👤 ملف تعريف المتداول المستهدف
- متداولو التقلب والاتجاه: مثالي لأولئك الذين يحتفظون بالمراكز لعدة أيام ويحتاجون إلى خريطة طريق للمقاومة المحتملة.
- المتداولون التناغميون: مثالي للمستخدمين الذين يعتمدون على نسب فيبوناتشي لكنهم يريدون إجراء الحسابات تلقائيًا.
- مستوى الخبرة: متوسط. يجب أن يفهم المتداولون أن هذه هي توقعات ويجب استخدامها جنبًا إلى جنب مع تأكيدات أخرى.
⚠️ القيود الهامة وملاحظات الاستخدام
- التحديث الديناميكي: ستتحرك التوقعات ومستويات التقلب "في الوقت الحقيقي" إذا تم إنشاء ارتفاع أو انخفاض جديد ضمن نافذة النظر للخلف.
- التهيئة: يحتاج المؤشر إلى كمية دنيا من التاريخ (تعادل فترة النظر للخلف) قبل أن يتمكن من البدء في الرسم بدقة.
الملخص
ملخص الذكاء الاصطناعي
Price Projection Swing Volume is an advanced indicator designed for swing and trend traders to forecast potential future price movements. It analyzes recent price swings within a user-defined lookback period (default 50 bars) to identify extreme swing points—the highest highs and lowest lows—and calculates key Fibonacci retracement levels (23.6%, 38.2%, 50%, 61.8%, 78.6%) within the current market range. Using a harmonic projection ratio (default 0.618), it generates a three-segment zigzag projection path that maps likely price targets.
The indicator visually displays horizontal swing boundary lines (red for highs, green for lows), dotted diagonal projection lines with percentage gain or loss labels, and target price boxes indicating exact projected price levels. These features help traders set take profit targets, anticipate retracements or reversals, and identify measured moves consistent with harmonic patterns.
Key customizable settings include the lookback period for swing scale, projection ratio for target aggressiveness, and visual color options for bullish/bearish projections and Fibonacci levels. The indicator updates dynamically as new highs or lows form within the lookback window and requires sufficient historical data to initialize.
Price Projection Swing Volume supports multiple markets including BTCUSD, EURUSD, GBPUSD, NZDUSD, XAUUSD, NAS100, and USDJPY, making it suitable for traders using Fibonacci-based harmonic strategies and swing trading approaches.
ملف تعريف المؤشر
تقييمات العملاء
0.0
التقييمات: 0
تقييمات العملاء
لا توجد تقييمات لهذا المنتج حتى الآن. هل جرَّبته بالفعل؟ كن أول من يخبر الآخرين!
مناقشة
الأسئلة الشائعة
BTCUSD
Fibonacci
ZigZag
Scalping
EURUSD
GBPUSD
NZDUSD
XAUUSD
NAS100
USDJPY
يتم توفير المنتجات المتاحة من خلال cTrader Store، بما في ذلك روبوتات التداول والمؤشرات والإضافات، من قبل مطوري الطرف الثالث وإتاحتها لأغراض الوصول المعلوماتي والفني فقط. cTrader Store ليس وسيطًا ولا يقدم نصائح استثمارية أو توصيات شخصية أو أي ضمان للأداء المستقبلي.


![شعار "[Stellar Strategies] MARSI Signal Plotter"](https://cdn.ctrader.com/image/webp/7b2b8da6-8f8e-4646-8d4a-4710c516c01e_25567)


![شعار "[Hamster-Coder] Moving Average MTF"](https://cdn.ctrader.com/image/webp/b11b98b1-194d-4b8e-b00e-d611826ad159_31226)

![شعار "[Stellar Strategies] Inside Bar with Signals"](https://cdn.ctrader.com/image/webp/1d9e8bfa-3b2c-4440-bb37-5856902008a7_30683)

السعر
منذ 03/10/2024
163
المبيعات
39.2K
التثبيتات المجانية