

Description
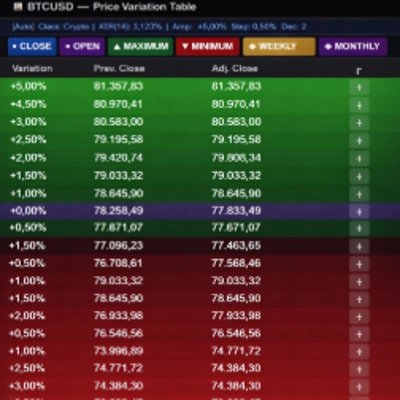
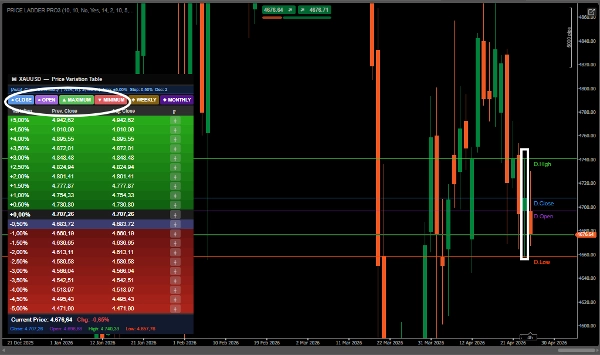
This is an institutional price reading tool based on percentage levels + liquidity reference.
🧠 Asset Class Recognition
Forex, Crypto, Indices, Commodities, Stocks, Futures
🔎 WHAT THIS INDICATOR REALLY DOES
It transforms the market into:
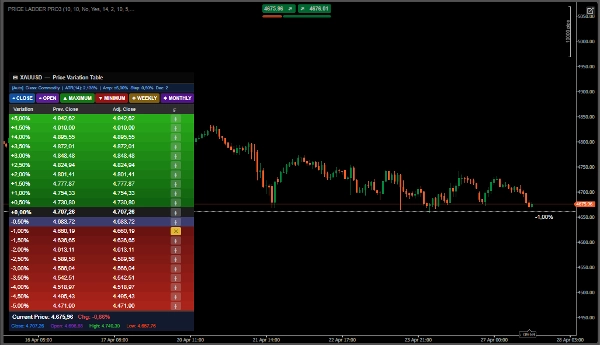
1. 📊 Percentage zones from the previous close
Ex: +0.5%, +1%, -1%, -2%...
This creates a kind of price expansion map
👉 This is VERY used by institutional investors (implied daily volatility)
📍 Automatic key levels
You can turn on:
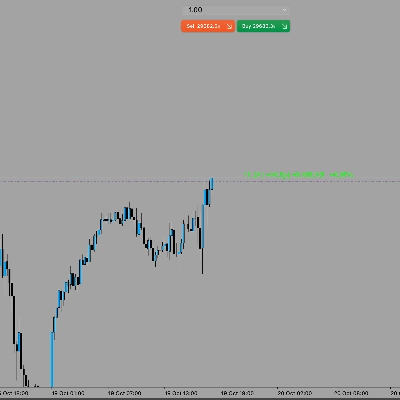
Previous close
Previous open
High/low
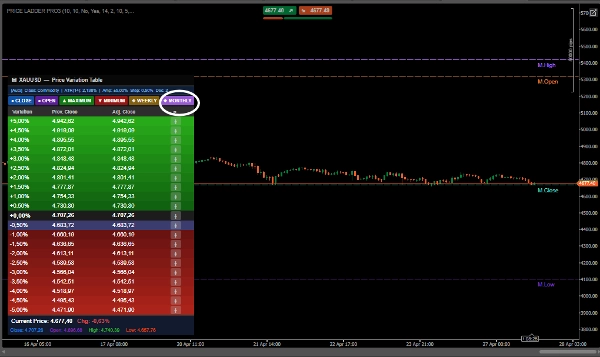
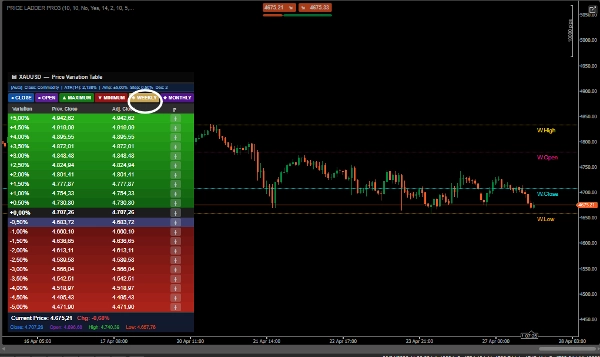
Weekly range
👉 This = liquidity + institutional reference
3. 🎯 Custom lines (╋ button)
You can manually mark important levels
👉 This becomes dynamic support/resistance
🧠 BEST STRATEGIES FOR USE
1. 🚀 BREAKOUT AND EXPANSION Strategy (the best)
How to use:
Connect:
Previous close
High / low
Weekly or monthly
Note:
If the price breaks:
Previous high
+1% / +1.5% / +2% (automatic calculation of variation per asset)
👉 This indicates institutional expansion
2. 🔄 REVERSAL Strategy (mean reversion)
This indicator is excellent for this.
How to use:
If the price reaches:
+2% / +3%
or -2% / -3%
👉 High chance of:
Exhaustion Pullback
Entry:
✔ Sell:
Region +2% or +
With rejection (wick/candle)
✔ Buy:
Region -2% or -
Target:
Return to:
👉 0% (previous close)
👉 This works VERY well on:
XAUUSD EURUSD in sideways movement
3. 🏦 INSTITUTIONAL Strategy (best real-world use)
This is where your indicator shines.
Concept:
Institutional investors think like this:
Where is the price relative to the previous day?
How much has it expanded?
There's still room for improvement.
Main features of the Turtle Strategy:
1. Automatic Breakout Levels
Shows High and Low of the previous period (yesterday/week/month)
Displays Close and Open as reference points
Perfect for identifying 20/55 day breakouts (you can adapt this)
2. Expansion Levels by Percentage Variation
Similar to the Turtle's volatility unit concept
Allows you to see price levels with X% variation
Useful for setting profit targets (e.g., 2% above the breakout)
3. Quick Buttons
MAXIMUM/MINIMUM: Shows resistance/support levels
WEEKLY/MONTHLY: Long-term seasonality
4. Auto-Adjustment by ATR
ATR is the heart of the Turtle (positioning by volatility)
Automatically calculates ranges based on real volatility
Summary
Key features include:
- Automatic display of critical price levels such as previous close, open, high/low, and weekly range.
- Customizable lines for marking important support and resistance levels.
- Integration of Average True Range (ATR) for volatility-based automatic range adjustments.
- Quick-access buttons to show maximum/minimum and weekly/monthly levels.
The indicator supports several trading strategies:
1. Breakout and Expansion: Identifies institutional expansion by monitoring price breaks above previous highs and percentage thresholds.
2. Reversal (Mean Reversion): Highlights potential exhaustion pullbacks when price reaches significant positive or negative percentage zones.
3. Institutional Strategy: Emulates institutional investor behavior by tracking price relative to prior periods and expansion levels, aiding in breakout and target setting.
PRICE LADDER PRO 3.1 outputs visual price levels and supports tick data input, facilitating detailed market structure and volatility analysis for professional trading decisions.
Discussion
Customer reviews
5 | 50 % | |
4 | 50 % | |
3 | 0 % | |
2 | 0 % | |
1 | 0 % |
FAQ














Price