present
Sign up and get $50 off your first purchase
Since 28/06/2025

Description

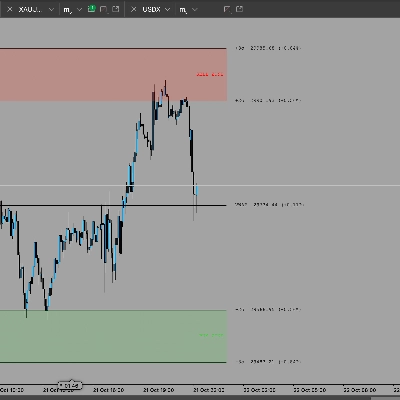
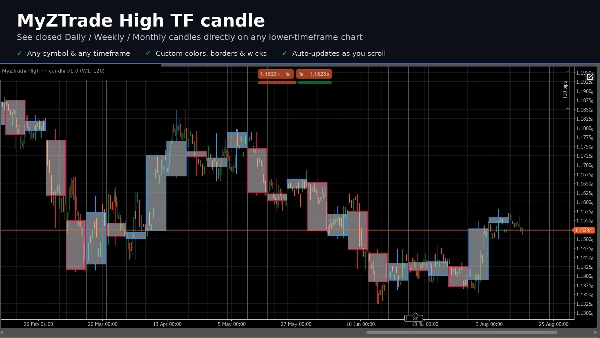
MyZTrade High TF candle is a multi-timeframe visualisation tool that overlays completed higher-timeframe candles (Daily, Weekly or Monthly — selectable) directly on your current chart as coloured boxes with a body, a border and high/low wicks, similar to seeing a D1 or W1 candle without switching charts.

Only closed higher-timeframe candles are drawn. The candle that is still forming is intentionally skipped, so a box never changes shape while its period is still open — it appears only once the period has fully closed.

Indicator type: multi-timeframe overlay / price-action context tool. Works on any symbol and any lower timeframe (e.g. M15, H1, H4).

Key features:

  • Higher timeframe is selectable: Daily, Weekly or Monthly
  • Number of visible boxes is configurable, so chart load stays under control on long histories
  • Separate fill and border colours for bullish and bearish candles
  • Optional high/low wicks on each box
  • Automatically redraws when you scroll the chart

Trading use cases: read higher-timeframe support/resistance zones and daily or weekly bias while executing on a lower timeframe, and study how price behaves inside a completed higher-timeframe range without switching charts back and forth.

Summary

AI summary
MyZTrade High TF candle is a multi-timeframe visualization indicator designed to overlay completed higher-timeframe candles—Daily, Weekly, or Monthly—directly onto a lower timeframe chart (e.g., M15, H1, H4). It displays these higher timeframe candles as colored boxes with distinct bodies, borders, and optional high/low wicks, providing a clear view of higher timeframe price action without switching charts. Only fully closed higher timeframe candles are shown, ensuring that the displayed boxes remain static and do not change shape during the current period. Users can configure the number of visible boxes to manage chart load and customize separate fill and border colors for bullish and bearish candles. The indicator automatically redraws when scrolling the chart. This tool aids traders in identifying higher timeframe support and resistance zones and assessing daily or weekly market bias while executing trades on lower timeframes. It supports any symbol and serves as a price-action context tool for enhanced multi-timeframe analysis.
Indicator profile

Discussion

Customer reviews

0.0
Reviews: 0
Customer reviews
No reviews for this product yet. Already tried it? Be the first to tell others!

FAQ

Inside Bar
Engulfing
Fair Value Gap
BOS
Imbalance
CHOCH
Support & Resistance
Products available through cTrader Store, including trading bots, indicators and plugins, are provided by third-party developers and made available for informational and technical access purposes only. cTrader Store is not a broker and does not provide investment advice, personal recommendations or any guarantee of future performance.

Price

Since 28/06/2025