Jeśli spędziłeś trochę czasu na rynkach Forex, wiesz, jak trudno jest ustalić, która waluta naprawdę napędza ruch, zwłaszcza gdy patrzysz na wiele par. Często chciałem mieć jaśniejszy sposób na zobaczenie indywidualnej wydajności głównych walut, a nie tylko tego, jak zachowuje się jedna para.
Dlatego opracowałem ten wskaźnik względnej siły walut.
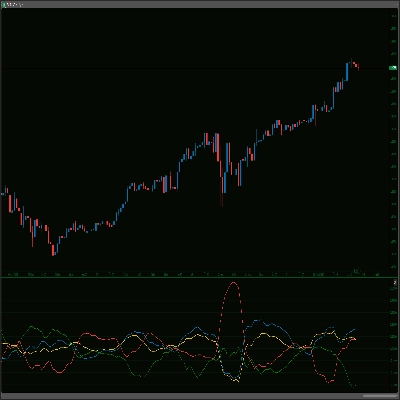
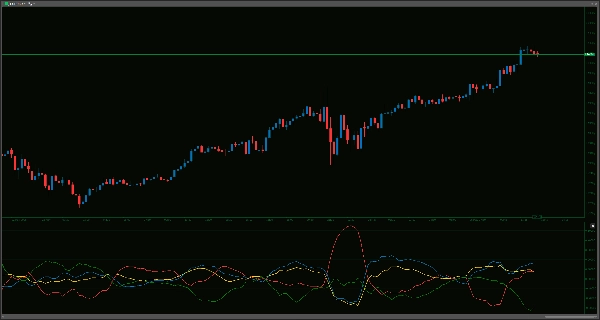
Idea jest dość prosta: ma na celu mierzenie i wyświetlanie względnej siły AUD, USD, EUR i JPY. Robi to, analizując, jak każda z tych walut radzi sobie w stosunku do koszyka innych (konkretnie na parach takich jak AUDUSD, AUDEUR, AUDJPY, EURUSD, EURJPY i USDJPY) w okresie cofania, który możesz zdefiniować.
Jak okazał się pomocny i jak może pomóc Tobie:
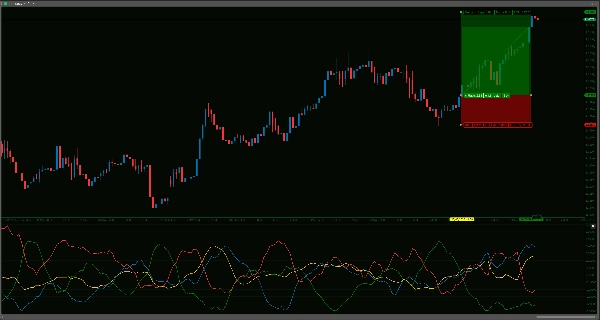
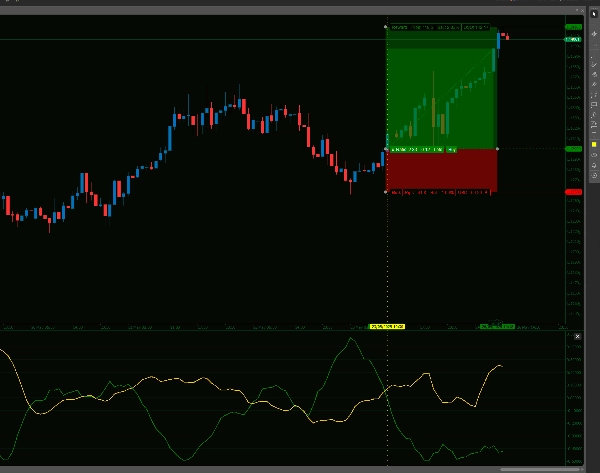
- Lepszy wybór par: Czasami widząc, że na przykład AUD konsekwentnie się umacnia, podczas gdy JPY słabnie, możesz zostać zachęcony do bliższego przyjrzenia się AUD/JPY. Może to pomóc zawęzić pary, na których się skupiasz.
- Zrozumienie czynników rynkowych: Gdy para taka jak EUR/USD się porusza, czy to głównie siła USD, czy słabość EUR? Ten wskaźnik może dać Ci pewną perspektywę na ten temat, pomagając zrozumieć szerszy przepływ.
- Dostosuj do swojego stylu:
-
- Możesz dostosować
LookbackPeriod(domyślnie 14 świec). Krótszy okres będzie bardziej responsywny, dłuższy pokaże bardziej ustalone trendy. - Jest też
SmoothingPeriod(domyślnie 5 świec), który stosuje EMA do linii siły. Może to pomóc zmniejszyć trochę szumu, jeśli wolisz płynniejszy wynik. Jeśli chcesz surowe obliczenia, ustaw wygładzanie na 0.
- Możesz dostosować
- Czytelne wizualizacje: Rysuje siłę każdej waluty jako osobną linię w osobnym oknie pod głównym wykresem, więc nie zaśmieca Twojej akcji cenowej.
- Niezawodne dane: Obliczenia są wykonywane na zamknięciu każdej świecy, więc linie nie będą się przerysowywać ani zmieniać po zakończeniu świecy.
Żaden wskaźnik nie jest kulą kryształową i ten nie jest wyjątkiem. To narzędzie. Uważam, że jest użyteczną częścią mojego procesu analizy, szczególnie do potwierdzania pomysłów lub szybkiego przeglądu, co robią główne waluty.
Uwaga, ponieważ ten wskaźnik pobiera dane dla wszystkich par walutowych, aby skutecznie obliczyć prawdziwą względną siłę, może być zasobożerny i czasami powodować awarie Ctradera, jeśli masz również inne zasobożerne wskaźniki. Miałem taką sytuację raz w ciągu ostatniego miesiąca na moim 5-letnim komputerze, więc nie powinno się to zdarzać regularnie. Jeśli jednak się zdarzy, proste odświeżenie okna czasowego lub drobna zmiana ustawień okresu o +/-1 wymusi ponowne obliczenie i wskaźnik pojawi się ponownie.
--------------------------
Zapraszam do sprawdzenia moich innych wskaźników!
https://ctrader.com/products/1181
https://ctrader.com/products/1182
https://ctrader.com/products/1180
https://ctrader.com/products/1015
https://ctrader.com/products/555
https://ctrader.com/products/553
https://ctrader.com/products/554
https://ctrader.com/products/552
https://ctrader.com/products/557
https://ctrader.com/products/845
https://ctrader.com/products/848
https://ctrader.com/products/847
https://ctrader.com/products/846
https://ctrader.com/products/551
https://ctrader.com/products/574
https://ctrader.com/products/573
https://ctrader.com/products/556
https://ctrader.com/products/558
5 | 67 % | |
4 | 33 % | |
3 | 0 % | |
2 | 0 % | |
1 | 0 % |


![Logo „High-Low Divergence [Iridio Capital]”](https://cdn.ctrader.com/image/webp/443c4661-7abb-40f1-842f-4b6ec560649b_40914)


