„Side Volume Profile“-Logo
Side Volume Profile
5.0
Bewertungen: 1
In „Side Volume Profile“ hochgeladenes Bild
Seit 26/05/2025
347.27M
Gehandeltes Volumen
59.74K
Pip-Gewinn
12
Verkäufe
1.09K
Kostenlose Installationen

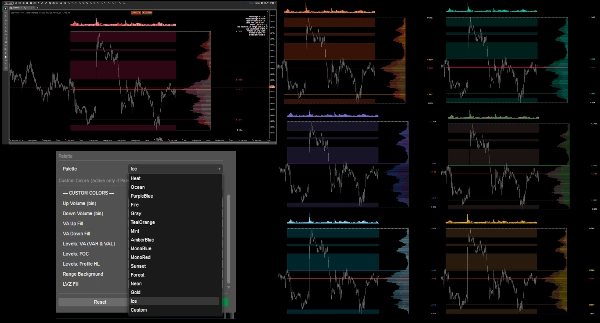
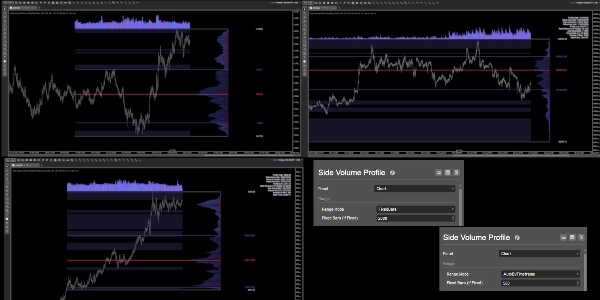
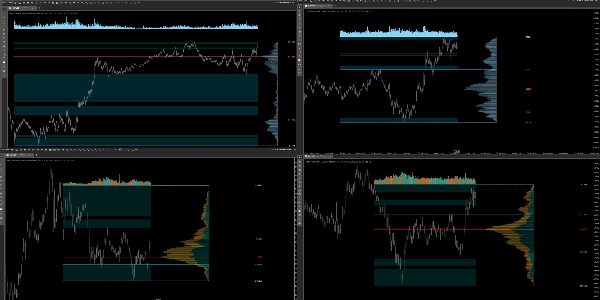
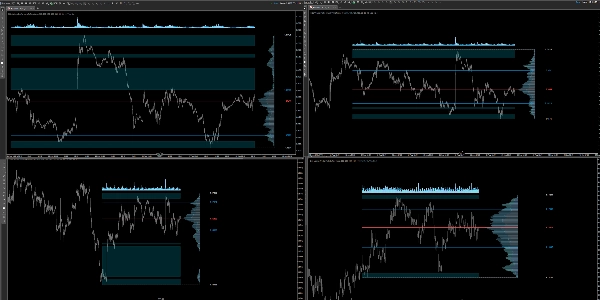
A right-side Volume Profile, that is always pinned to the last bars and doesn’t jump when you pan the chart. It computes volume-by-price over a chosen range (auto by timeframe or a fixed bar count), shows POC, VAH/VAL, profile bounds (High/Low), highlights low-volume zones (LVZ), and draws a volume histogram with EMA above the range (offset in pips). Includes a top-right stats panel, several high-contrast palettes plus custom colors, global bin opacity, width/offset controls, and per-line thickness/style. Built for readability and performance.

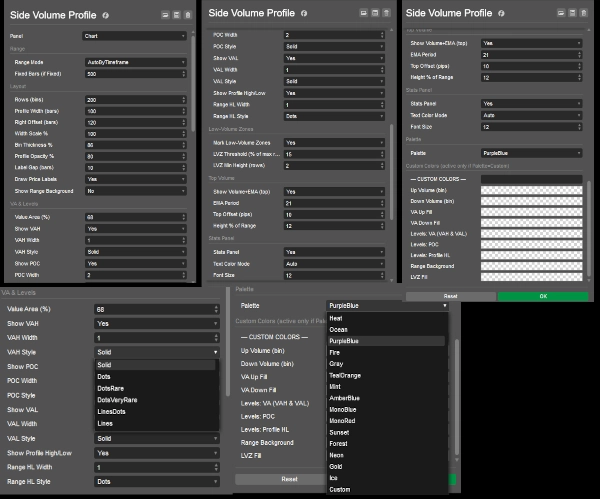
  • Range: AutoByTimeframe or FixedBars.
  • Layout: Rows (bins), Profile Width / Width Scale, Right Offset, Bin Thickness, Label Gap, profile opacity; optional range background.
  • VA & Levels: Value Area %, toggle VAH/POC/VAL, per-level line width & style; profile High/Low.
  • Low-Volume Zones: Threshold (% of max row) and minimum height (rows).
  • Top Volume: EMA period, height (% of range), default offset 10 pips.
  • Palette/Custom: Pick a theme or set your own colors (VAH = VAL).
  • Stats Panel: Toggle, font size

Documentation of indicator

Indikatorprofil
5.0
Bewertungen: 1
5
100 %
4
0 %
3
0 %
2
0 %
1
0 %
Kundenbewertungen
February 15, 2026
BTCUSD
Forex
Indices
EURUSD
Commodities
GBPUSD
NZDUSD
Prop
Fair Value Gap
SMC
Crypto
Stocks
XAUUSD
NAS100
USDJPY
VWAP
Über den cTrader Store verfügbare Produkte, einschließlich Handelsbots, Indikatoren und Plugins, werden von externen Entwicklern bereitgestellt und nur zu Informations- und technischen Zugriffszwecken verfügbar gemacht. cTrader Store ist kein Broker und erbringt keine Anlageberatung, persönlichen Empfehlungen oder eine Garantie für zukünftige Performance.

Mehr von diesem Autor

Heatmap of intra-HTF volume (POC/VA) built from LTF tick data; paints current candle and auto-loads visible history.
Overlay HTF context on any chart: color bars by HTF and draw filled HTF bodies with optional High/Low lines.
Candle Volume Profile for Crypto
Session boxes, liquidity sweeps and higher‑timeframe levels for intraday trading
Pro VSA tool with 3 modes: Fixed Ratios, Standard Deviation & Contextual VSA.
Tracks N-period highs/lows, HTF overlay, HUDs with ADX, RSI, session clocks. Customizable for precise trading.
10 configurable moving averages: choose type, period, color per line; single price source for all.
Edge-aware clouds + Pro HUD: better entries, calmer exits, adaptive risk.
Market entropy + DC. Spot crystallization/chaos shifts with an optional on-chart overlay.
A multi-TF panel with candle timers, sessions, ticker, spread & 15+ themes. Fully customizable.

Das könnte Sie auch noch interessieren

Scalping & Swing signals in one. Smart S/R, Auto SL/TP, HTF panel. No repainting. Built for serious traders.
Enhance trading with ATR Bands! Visualize market volatility using dynamic upper and lower ATR bands for precise decision
Unlock the power of a professional-grade indicator that brings together the most effective tools in technical analysis.
Traders Panel: Scan 15 pairs across 5 timeframes. Live heatmap, strength rankings and best setups in one panel.
Overbought Oversold Indicator
The Triple Momentum indicator for cTrader is a versatile trend-following tool.
Auto Fibonacci Retracement Indicator.
Sero is a stochastic-based momentum oscillator that gives clear, color-coded visual signals for market momentum shifts.
🇫🇷 Visualisez vos sessions de marché et OPR d'un coup d’œil 🇬🇧 Visualize your market sessions & OPR at a glance !
It draws a step line that visualize the movement of H4. Particularly effective when trade on lower timeframe.
This indicatorFull Description: Th shows the open price lines at key market times based on Eastern Standard Time (EST).
Marks liquidity zones at swing highs/lows, tracks touches, and confirms breaks to improve entries and structure clarity.
Spot breakouts & filter fakeouts with dynamic volatility bands + ALMA trend validation. 100% Free.
Smart trendline breakout indicator with auto signals, targets, and ATR-based zones for precise trade execution.
Breakout Multi-Timeframe Strategy Indicator
Integrated Market Analysis: Volume Profile + Statistical Projection 🎯
Displays the POC line for previous sessions in an easy to see manner.
Smart Money traders, it extends key levels until mitigation, helping you track liquidity, structure
Seit 26/05/2025
347.27M
Gehandeltes Volumen
59.74K
Pip-Gewinn
12
Verkäufe
1.09K
Kostenlose Installationen