present
가입하고 첫 구매 시 $50 할인을 받으세요
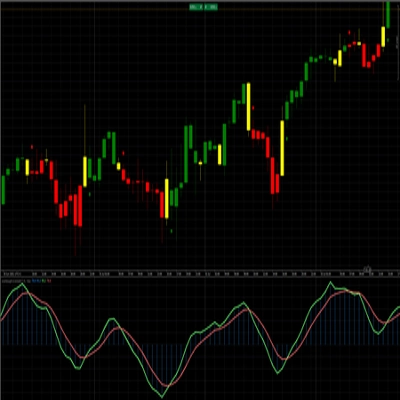
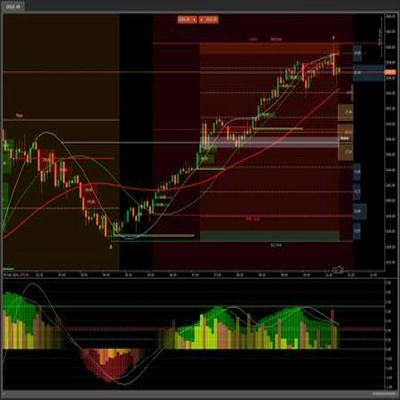
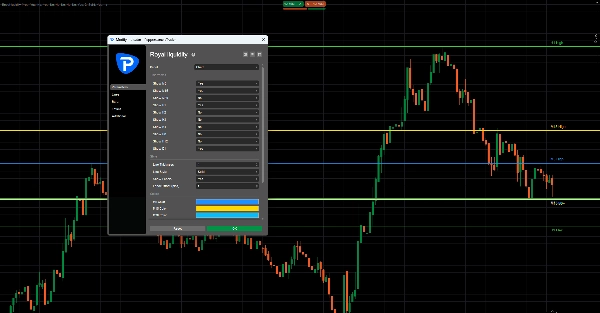
Trading product for Royal liquidity X 지표 Supertrend Liquidity Sweep, image 1
Royal liquidity X
지표
버전 1.0, May 2026
Windows, Mac
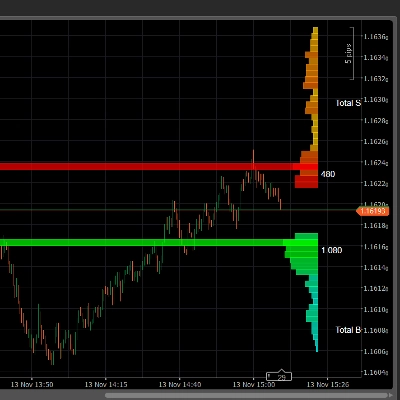
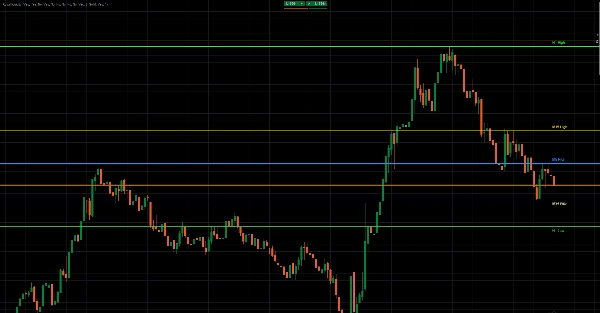
Trading product for Royal liquidity X 지표 Supertrend Liquidity Sweep, image 2
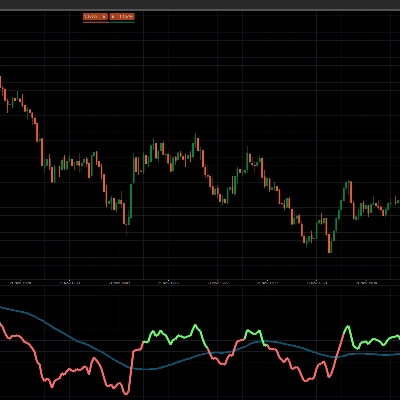
Trading product for Royal liquidity X 지표 Supertrend Liquidity Sweep, image 3
86
판매
1.18K
무료 설치

설명

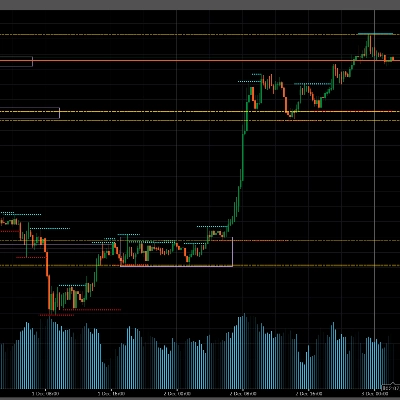
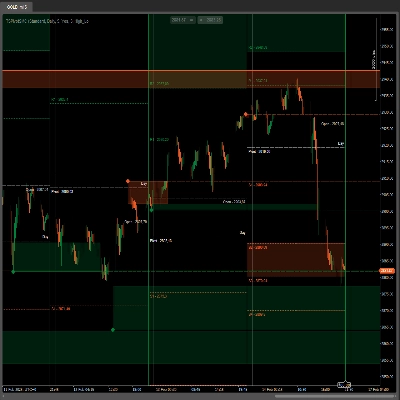
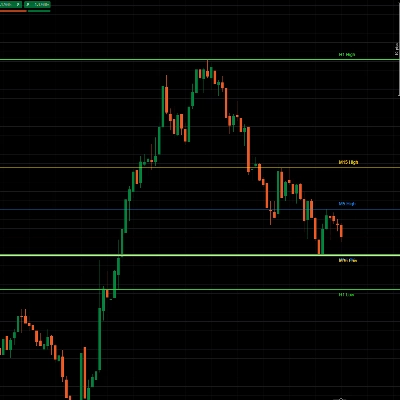
Royal Liquidity X is a clean and powerful multi-timeframe liquidity level indicator designed to display the previous high and previous low from multiple key timeframes directly on the chart.

The indicator helps traders quickly identify important liquidity zones where price may react, sweep liquidity, reject, break out, or continue with momentum. By plotting previous highs and lows from timeframes such as M5, M15, M30, H1, H2, H3, H4, H8, H12, and D1, Royal Liquidity gives traders a clear overview of the most relevant intraday and higher-timeframe liquidity levels.

These previous highs and lows are often watched by traders because they can act as potential stop-loss zones, breakout areas, reversal points, or price magnets. Royal Liquidity makes these levels visible automatically, without the need to manually draw them every session.

How It Works

Royal Liquidity reads the most recently closed candle from each selected timeframe. For every enabled timeframe, it takes the previous candle’s high and low and plots them as horizontal levels on the active chart.

For example:

M15 High = High of the last closed M15 candle
M15 Low = Low of the last closed M15 candle
H1 High = High of the last closed H1 candle
H1 Low = Low of the last closed H1 candle
D1 High = High of the last closed daily candle
D1 Low = Low of the last closed daily candle

The indicator updates only on the latest chart bar, keeping the chart efficient and lightweight. Each timeframe can be turned on or off individually, and every level can have its own custom color. Traders can also adjust line thickness, line style, labels, and label offset.

What It Shows

Royal Liquidity can display:

Previous M5 High / Low
Previous M15 High / Low
Previous M30 High / Low
Previous H1 High / Low
Previous H2 High / Low
Previous H3 High / Low
Previous H4 High / Low
Previous H8 High / Low
Previous H12 High / Low
Previous D1 High / Low

Each level is drawn as a horizontal line, with optional labels such as M15 High, M15 Low, H1 High, H1 Low, and D1 High / Low.

Trading Use Cases

Royal Liquidity can help traders identify:

Liquidity sweeps
Price may move above a previous high or below a previous low to collect liquidity before reversing.

Breakout zones
A strong break above a previous high or below a previous low can signal continuation or momentum.

Reversal areas
Previous highs and lows can act as important reaction zones where price may reject.

Intraday targets
Higher-timeframe highs and lows can be used as potential target zones.

Market structure context
The indicator helps traders see where price is trading relative to important previous candle levels.

Short Marketplace-Style Version

Royal Liquidity is a multi-timeframe previous high and low indicator built to reveal key liquidity levels directly on your chart. It automatically plots the previous highs and lows from selected timeframes, including M5, M15, M30, H1, H4, H12, and D1.

Designed for liquidity-based traders, breakout traders, scalpers, and intraday traders, Royal Liquidity helps identify potential sweep zones, breakout areas, reversal levels, and profit targets with a clean visual layout.

Disclaimer

Royal Liquidity is a technical analysis tool and does not guarantee profitable trades. It should be used together with risk management, market structure analysis, and a complete trading plan.

요약

지표 프로필
지표 카테고리
추세
출력 유형
신호
데이터 요구 사항
틱 데이터
지원되는 신호
돌파
크로스
레벨 돌파
반전

상담

고객 리뷰

0.0
리뷰: 0
고객 리뷰
이 상품에 대한 리뷰가 아직 없습니다. 이미 사용해 보셨나요? 다른 사람들에게 가장 먼저 소개해 주세요!

자주 묻는 질문(FAQ)

Supertrend
Liquidity Sweep
Liquidity Grab
트레이딩 봇, 지표, 플러그인 등 cTrader Store에서 제공되는 상품은 제3자 개발자에 의해 제공되며, 이는 단순히 정보 및 기술적 접근을 목적으로 제공된 것입니다. cTrader Store는 중개인이 아니며, 투자 조언, 개인별 추천 또는 향후 성과에 대한 어떠한 보장도 제공하지 않습니다.

이 작성자의 상품 더 보기

지표
AI
ATR
+27
SR Commander is a clean and intelligent support and resistance indicator for cTrader, built to help traders identify key
지표
AI
ATR
+20
Buy and Sell Signals
지표
AI
ATR
+27
WICK COMMANDER — Know Exactly When the Market Commits
지표
AI
ATR
+27
Overbought Oversold Indicator
지표
AI
ATR
+20
Know Sure Thing (KST) momentum engine
지표
AI
SMC
+5
Coloring trendline/ Colored Trendline / Color Trendline
지표
AI
ATR
+27
VWAP Sniper Elite -- Institutional Trend Engine
지표
AI
SMC
+13
Dynamic Liquidity Depth exposes hidden volume
지표
AI
ATR
+26
Entry Momentum MACD Power Guide
지표
AI
ATR
+27
The Professional “All-in-One” Trading Suite (buy and sell indicator)
지표
AI
ATR
+26
SR Commander — Multi Timeframe Edition. See where the big money draws the line. Trade on your timeframe. Think on theirs
"crossover 1" 로고
최고 평점
4.2
(5)
$19
/
$29
지표
AI
Grid
+10
Crossover Buy and Sell Alerts and signals

좋아하실 만한 다른 항목

지표
Advanced customizable volume-profile indicator with buy/sell levels, delta analysis, multi-TF support and vivid gradient
지표
Forex
NZDUSD
+2
RCS: 8 majors! AUD,USD,EUR,JPY,GBP,CAD,CHF,NZD. Find how strong each currency is relatively and trade smarter!
지표
ATR
Scalping
+1
Auto Fibonacci Retracement Pro – Smart Swing & Golden Zone Levels
지표
AI
SMC
+9
Identifies market trends (-10 to +10) using HMA with volume confirmation. Includes customizable alerts.
지표
SMC
Forex
+5
Pinpoint FVGs, track fills and see mitigation stats — trade imbalances with clarity and confidence.
지표
Prop
Forex
+12
Introducing High Accuracy multi timeframe Swing high and low detector.
지표
AI
Grid
+9
Pivot Point MultiTimeFrame with Order Block
지표
AI
ATR
+26
Exploit market imbalances with auto FVG zones—fade, extend, and filter with precision.
"MARainbow" 로고
최고 평점
4.2
(4)
$19
/
$38
지표
Forex
Crypto
+3
MARainbow gives you the edge with four customizable moving averages—each color-coded for instant recognition.
지표
MACD
Forex
+1
😎Read the description before purchasing💩
지표
Aggressive
Supertrend
+5
Stop trading with tunnel vision! 🚫 The Heat Map Dashboard is an institutional-grade visual trading assistant
지표
ATR
MSS
+5
Advanced market structure and institutional cycle mapper with visual reference cards and entry alerts
지표
BOS
EMA
+5
VWAP Bands indicator with 3 standard deviation levels, buy/sell zones, and a draggable ON/OFF button to toggle the entir
지표
ATR
Market Structure
+3
Support Resistance Toolkit
지표
ATR
BOS
+5
Opening ranges, dynamic trend channels, and multi-scale breakout/retest analysis for clear intraday chart decisions.
지표
EMA
AI-assisted
+1
Multi EMA Timeframes lets you stay on your chart and see the exact EMA from any timeframe you choose — up to 5 at once.
지표
Parabolic SAR Alert - Trend reversal alerts with smart signals & custom alerts.
지표
Supply & Demand
Support & Resistance
RAF Supply Demand Lite v1.0 automatically detects clean Supply and Demand zones using confirmed swing highs and lows. Zo

가격

86
판매
1.18K
무료 설치