MA Sabres
"MA Sabres" logo
11/08/2025
2
Desktop
Since 14/07/2025
Sales
19
"MA Sabres" uploaded image"MA Sabres" uploaded image"MA Sabres" uploaded image

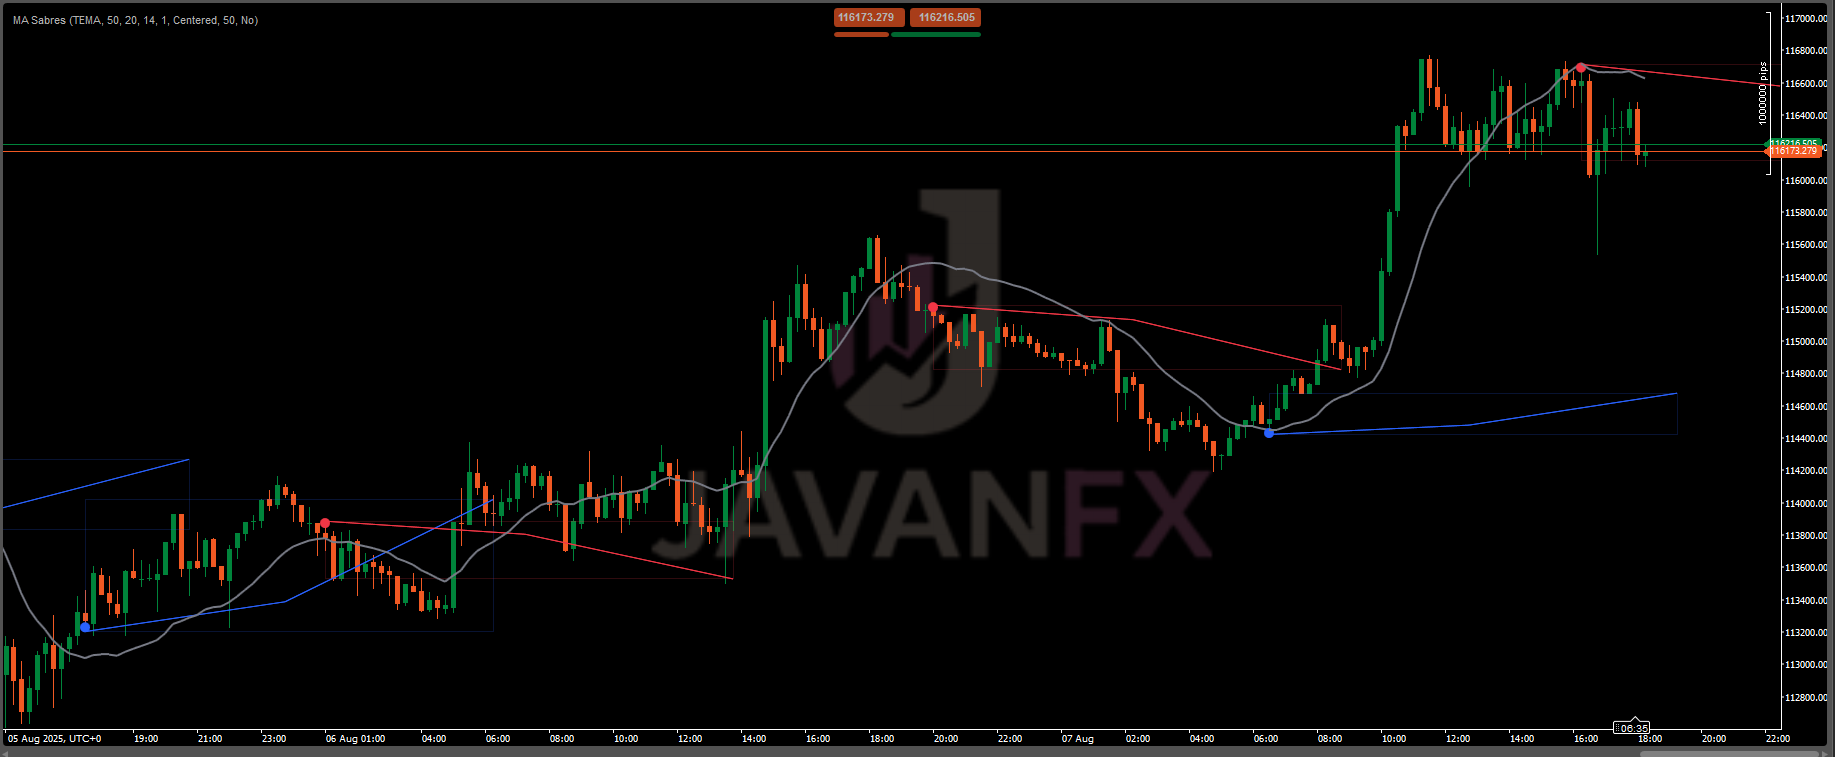
Dominate the markets with this electrifying indicator spots trend turnarounds using a dynamic moving average, unleashing bold 'Sabre' formations as support, resistance, or breakout zones. With customizable settings and razor-sharp alerts, it’s your secret weapon for trading triumphs!
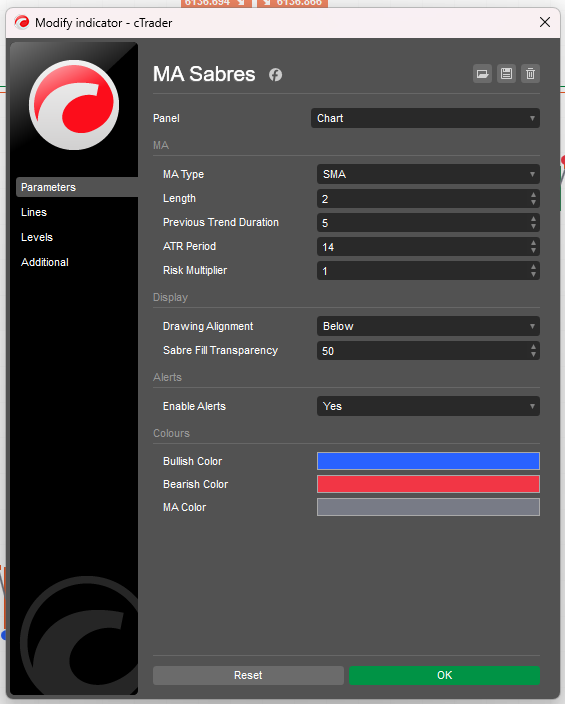

Configuration

  • MA Type: Pick your moving average from the dropdown (SMA, EMA, SMMA_RMA, HullMA, WMA, VWMA, DEMA, TEMA, NONE to disable). Default is TEMA for snappy signals.
    • Length: Set the MA and Sabre length (default: 50, min: 1) to control their scope.
    • Previous Trend Duration: Define how many bars (default: 20, min: 1) the MA must trend before a reversal triggers a Sabre.
  • ATR Period: Adjust the Average True Range period (default: 14, min: 1) to shape Sabre placement based on market volatility.
  • Risk Multiplier: Amplify or shrink the Sabre’s distance from price (default: 1.0, range: 0.1–5.0) for bolder or tighter signals.
  • Drawing Alignment: Position Sabres and circles Above, Below, or Centered (default: Centered) to avoid chart clutter.
  • Sabre Fill Transparency: Tweak the fill opacity (default: 50, range: 0–100) for a clear view.
  • Enable Alerts: Flip the switch (default: false) to get sound alerts.


How to Use

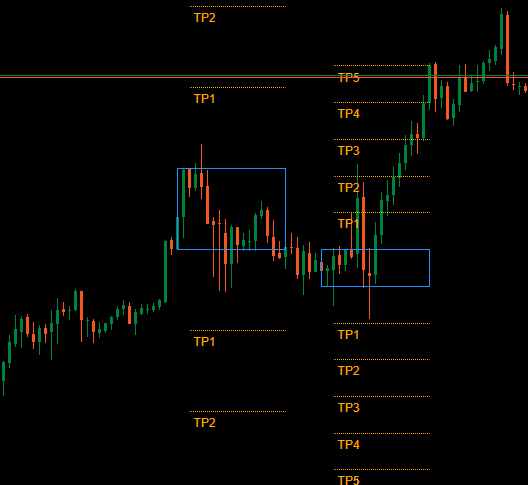
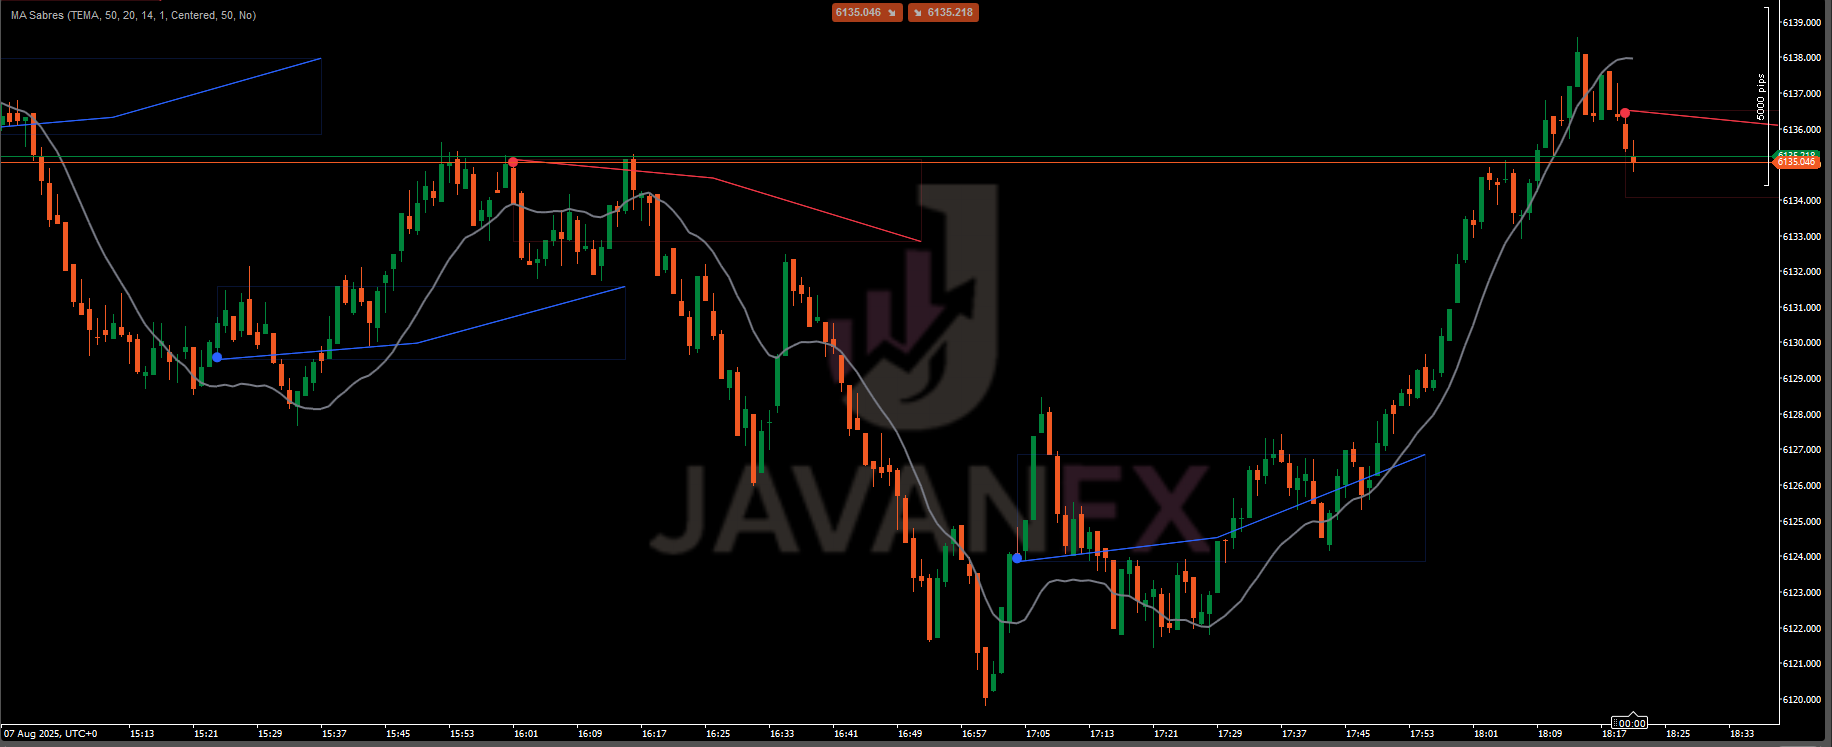
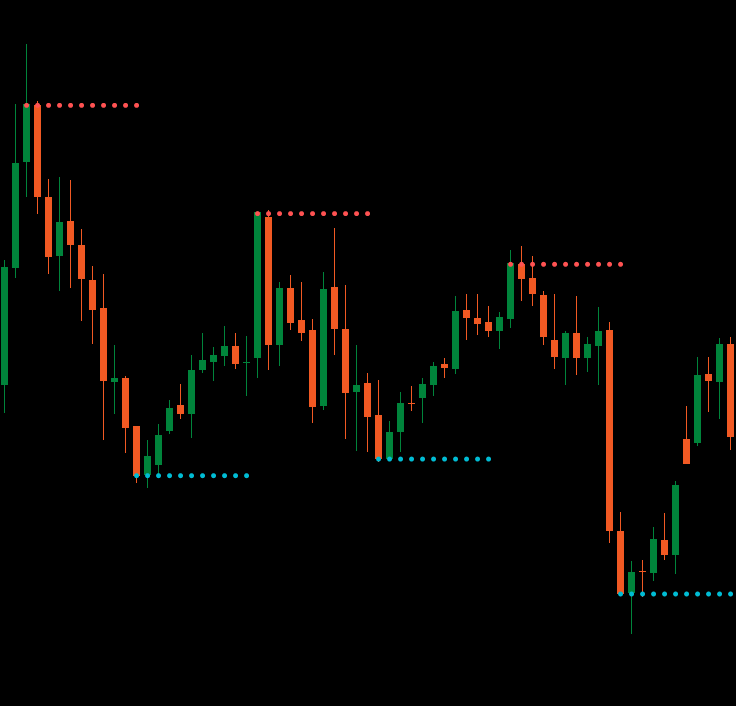
  1. Spot the Turnarounds:
    • Look for Sabres (four trend lines with a filled base) and circles (three layered icons) when the MA shifts after a steady trend.
    • Upward Sabres with blue circles signal a bullish surge; downward Sabres with red circles flag a bearish drop.
  2. Tweak Your Setup:
    • Shorten Length (e.g., 20) and Previous Trend Duration (e.g., 10) for fast moves in choppy markets.
    • Boost Risk Multiplier (e.g., 2.0) for wider Sabres in trends or dial it down (e.g., 0.5) for precision in ranges.
    • Shift Alignment to Above or Below if candles obscure the view.
  3. Harness Alerts:
    • Turn on EnableAlerts for real-time chart notifications.
  4. Trading Tactics:
    • Entry: Jump into a long trade on an upward Sabre/circle or a short on a downward one.
    • Exit: Trail the MA trendline as a stop or exit on the opposite Sabre signal.
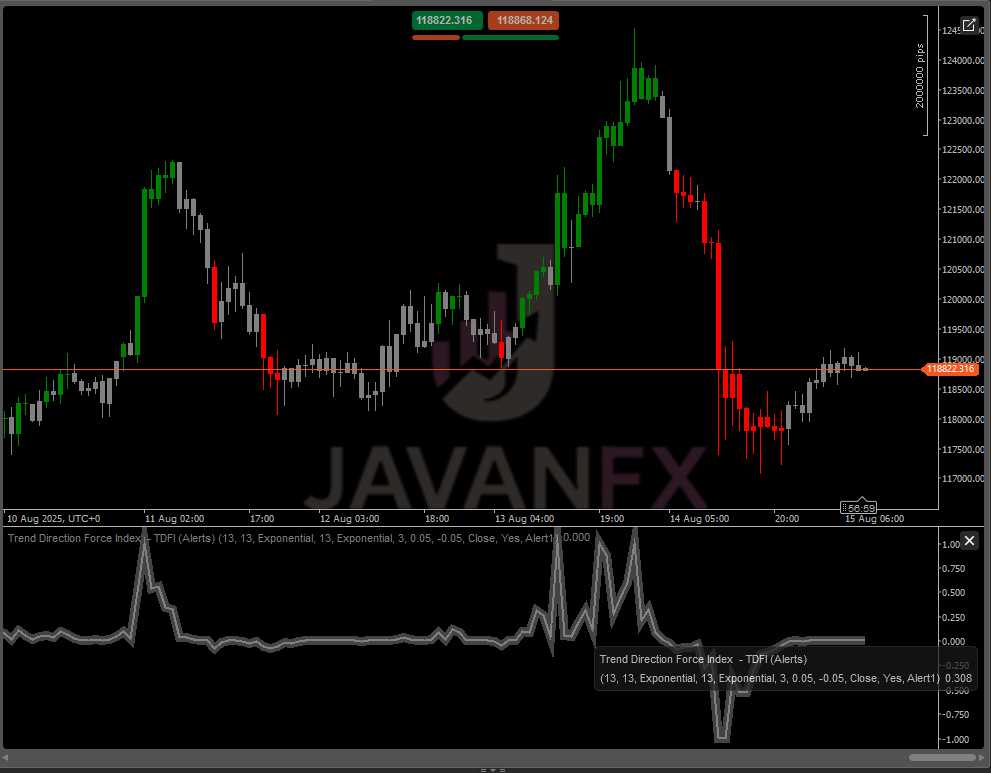
    • Validation: Combine with tools like UT Bot Alert, RSI or Bollinger Bands for rock-solid setups.
More from this author
Pivot Point Super Trend
Laser entries with pivot confirmation. No repaint, all timeframes. Professional results.
Zero Lag LSMA
ZLSMA: Zero-lag trend indicator! Catch trends fast with customizable settings. Boost your trading precision.
Alpha Sentiment Pro
Alpha Sentiment Pro - See the Market's Pulse Before It Moves
Parabolic SAR Alert
Parabolic SAR Alert - Trend reversal alerts with smart signals & custom alerts.
Parabolic RSI Alert  V1
Master RSI reversals with Parabolic SAR precision! Get real-time alerts for high-probability trend changes.
Bollinger Bands Breakout Oscillator (+ Alerts)
BB Breakout Oscillator with alerts! Spot trend reversals using Bollinger Bands. Bullish/Bearish crossovers Alerts.
Indicator
Indices
Commodities
Stocks
+4
UT Bot Alert
A powerful ATR-based indicator generating clear BUY/SELL signals. Features real-time alerts and customizable sensitivity
Trend Direction Force Index - TDFI (Alerts)
Spot Strong Trends Early & Filter Market Noise
Indicator
Indices
Stocks
ATR
+5
UT Bot Alerts Nova
UT Bot Alerts Nova: Advanced trend-following indicator using ATR for signals. Precise entries/exits.
SuperScalperBox
Super Scalper Box - Professional-Grade Trading Indicator
You may also like
SwingHighLow
Auto-detect swing highs/lows. Spot reversals, map structure, and filter noise with adjustable strength.
Renko Moving Average Cross Indicator
The Renko Moving Average Cross indicator combines classic EMA crossover signals with Renko-filtered prices.
Top-rated
Indicator
RSI
Breakout
Supertrend
+1
ZScore
Z-Score measures price deviation from its average, helping identify extremes, trends, and trading opportunities ........
Indicator
RSI
XAUUSD
Breakout
+6
Order Block
Identify bullish and bearish Order Blocks to spot key support/resistance levels and potential trend reversals! 📈🔄
Market Polarity Zones
implifies market analysis by automatically identifying bullish 🚀 or bearish 🐻 phases and marking key levels where ....
Indicator
NAS100
Indices
XAUUSD
+4
PrevDayProjection
Automatically calculates the previous day’s high and low, determines the range, and then projects Fibonacci levels.
PVA Volume+Analysis_noSourceCode
PVA Volume Analysis Indicator:Price volume over trend strength and direction
Session Highlight Framer
Frame the sessions
Indicator
Breakout
ATR
Signal
[Stellar Strategies] Market Structure Breakout
Flags breakouts of recent highs/lows on cTrader charts. Shows arrows/lines. Optional trend filter & sound alerts 📉📈
Indicator
Breakout
ATR
Supertrend
+3
Support Resistance Indicator
A custom support resistance indicator, specifically designed for scalping techniques.
Indicator
NAS100
NZDUSD
XAUUSD
+11
ADXVMA Aurora Trend Filter
⚡ ADXVMA Aurora Trend Filter combines ADX trend strength with an adaptive EMA blend ⚡
market session
Market session indicator (Asia, Frankfurt, New York, London)
Indicator
Breakout
Pivot Points Daily Session
Pivot Point with base zone daily Asia-London-New york Session.
Indicator
Indices
Prop
Stocks
+6
New Way Sar - Pro
The Parabolic SAR, or "Stop and Reverse," is a dynamic technical analysis tool
Parabolic SAR Alert
Parabolic SAR Alert - Trend reversal alerts with smart signals & custom alerts.
Indicator
Supertrend
Signal
SuperTrend Scanner
Supertrend Scanner – Track trends across assets & timeframes in real-time with alerts. Stay ahead, and trade smarter!
Indicator
Indices
Forex
EURUSD
+1
DXY w HMA
DXY HMA Indicator
Indicator
Breakout
ORB v1
Opening Range Breakout (ORB) - Visual Edition