Description
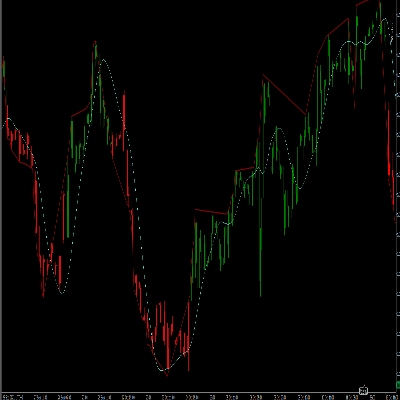
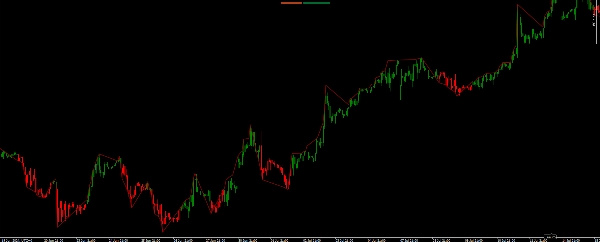
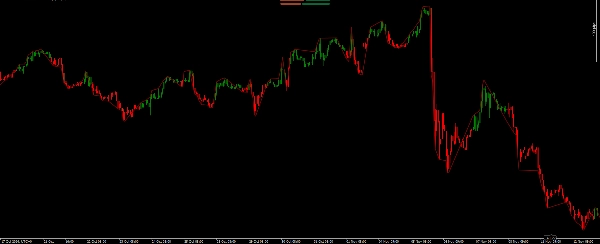
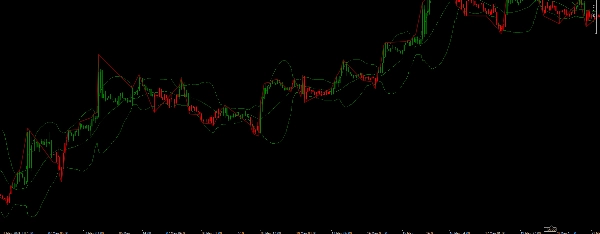
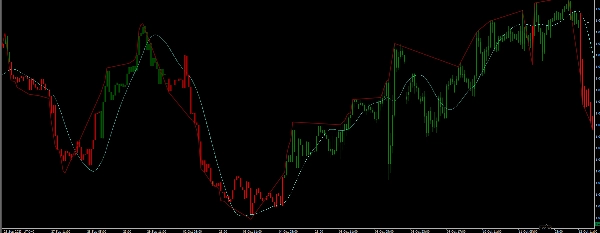
A custom support resistance indicator, specifically designed for scalping techniques to enhance your trading experience. This innovative tool colors bars based on market movements, effectively highlighting when prices bounce off support and resistance levels or move past a custom moving average analysis. By visually representing these critical market behaviors by coloring each bar, traders can quickly identify potential entry and exit points, making it ideal for fast-paced trading strategies. Whether you're a beginner or an experienced trader, this support resistance indicator helps simplify complex market Shift dynamics.
Recommended Scalping Techniques Used Alongside or in conjunction with any of the following:
Bollinger bands
Moving Averages
PSAR
Donchian Channels
Supertrend
Changeable Parameters:
Deviation Percentage - it incorporates a Deviation Percentage feature that gauges the volatility and strength of price movements.
Depth - A Depth component, providing the indicator with market order flow.
Backstep - A Backstep Analysis component that helps the indicator determine market movement.
The custom indicator is an essential tool for traders who specialize in scalping. By providing real-time insights into market movements, this indicator empowers traders to make quick, informed decisions. The ability to color bars based on price action around support and resistance levels allows for precise entry and exit points, making it ideal for implementing tight take profit (TP) and stop loss (SL) strategies. This approach minimizes risk while maximizing potential gains, enabling traders to navigate fast-paced markets with confidence.
How Pro Traders Use Support and Resistance Indicators
Support and resistance levels act as key turning points where market prices tend to pause or reverse. These levels are vital tools in technical analysis. Price barriers might look simple but they create powerful psychological effects that influence trading decisions by a lot.
The importance of these levels grows each time price tests them. Smart traders know they need to look at charts of all timeframes to find the best support resistance points. Daily and monthly analysis helps spot strong levels. These aren't random lines on charts - they show where buyers and sellers cluster together. Round numbers like $50 or $100 per share often create the strongest barriers.
This piece shows you advanced methods that professional traders use to spot and profit from these key price levels. You'll learn to blend these powerful indicators into your strategy. The guide helps you spot hidden patterns and handle risks better across timeframes.
Understanding Advanced Support and Resistance Indicators
Professional traders have changed their approach to support and resistance indicators over the last several years. Trading platforms today help us analyze these significant price levels with exceptional precision.
Rise of S&R Indicators in Modern Trading
Let's get into how support resistance indicators fit into today's markets. These levels now represent zones instead of precise lines. Trading platforms let us merge multiple timeframes and volume data at once to give us a complete view of market dynamics.
Key Components of Professional S&R Analysis
Professional traders pay attention to everything in:
- Volume-based confirmation methods
- Multi-timeframe analysis
- Dynamic zone identification
- Price action patterns
Supply and demand zones are more significant than traditional support and resistance levels. The core team creates these zones when they execute substantial trading actions.
Common Misconceptions Among Retail Traders
Retail traders don't deal very well with several misconceptions. Many believe support and resistance levels get stronger with multiple tests. Our analysis shows the opposite - levels become weaker with more tests. As with many traders who treat these levels as exact lines rather than zones, this leads to early exits or missed opportunities.
Traditional ApproachModern Understanding
Exact price lines
Price zones
Multiple tests strengthen
Multiple tests weaken
Single timeframe
Multi-timeframe analysis
Successful traders now make use of information about context and volume to assess the probability of lasting reversals. Experience teaches us to read price action at these key levels naturally and make better trading decisions.
Professional Trading Platform Integration
Professional trading platforms now offer sophisticated tools to analyze support and resistance. Let's explore how to use these advanced features in your trading setup.
Configuring Multi-Timeframe S&R Alerts
The successful integration of support resistance indicators begins with proper alert configuration. Modern platforms let you compare multiple timeframes at once. This helps traders see both the big picture and fine details to make better trading decisions.
To set up alerts that work:
- Set your primary trading timeframe first
- Add secondary timeframes to get broader context
- Create breach and bounce notifications
- Update candlesticks quickly to get timely signals
Custom Indicator Development for S&R
Creating custom indicators needs careful thought about core elements. You can create two main types of indicators:
TypeComponents
Unique Indicators
Core chart elements, mathematical functions
Hybrid Indicators
Combination of existing indicators
Real-Time Data Processing Techniques
Real-time data processing plays a vital role in accurate S&R analysis. Dynamic support and resistance calculations adapt to changing market conditions.
Our real-time data processing priorities include:
- Dynamic support/resistance line calculations
- Color-coded line differences
- Total overview across timeframes
- Simple interface navigation
The support resistance indicator's effectiveness depends on proper platform setup. Traders who use multi-timeframe analysis get an extra edge on shorter timeframes. Proper integration automates timeframe comparison and trendline identification.
The platform processes real-time data to find confluence zones where multiple timeframes join to strengthen support or resistance levels. Day traders and swing traders find this feature especially valuable for their strategies.
Hidden Pattern Recognition Techniques
Our analysis of advanced trading techniques shows hidden patterns that emerge at vital support and resistance levels. These subtle patterns give an explanation about potential market reversals.
Fractal Support and Resistance Patterns
Fractal patterns are the foundations of support and resistance analysis. These patterns have five consecutive bars, and the middle bar shows either the highest or lowest point. A bullish fractal happens when a low point has two higher low bars on each side. A bearish fractal takes shape when a high point has two lower high bars on each side.
Pattern TypeFormation Characteristics
Bullish Fractal
Lowest low in middle, higher lows on sides
Bearish Fractal
Highest high in middle, lower highs on sides
Volume-Based S&R Confirmation Methods
Volume is a vital confirmation tool to analyze support resistance indicators. The potential reversal points we look for include:
- Volume spikes at support or resistance levels
- Volume divergence during new highs or lows
- Strong volume confirmation during breakouts
These volume patterns work with price action to help us identify high-probability zones where candlestick formations signal potential reversals.
Advanced Fibonacci Integration
Our Fibonacci analysis goes beyond simple retracement levels. The Fibonacci Confluence Toolkit helps us identify potential price reversal zones by combining key market signals. These levels matter more when they line up with:
- Strong volume clusters
- Fractal pattern formations
- Key support and resistance zones
The filled zone between 0.618 and 0.786 Fibonacci levels offers a statistically strong area to enter positions. Our careful analysis shows that combining Fibonacci retracements with fractal patterns improves our chances to spot potential market reversals by a lot.
The integration of these advanced pattern recognition techniques with our support resistance indicator strategy creates a resilient framework to identify high-probability trading opportunities. This approach helps us spot hidden market patterns that many traders miss.
Risk Management Strategies for S&R Trading
Risk management is the life-blood of successful support and resistance trading. We have found that proper risk management starts with understanding how to size positions and place stops strategically.
Position Sizing Based on S&R Levels
Our position sizes are determined by account protection principles. Accounts under $50,000 limit risk to 3% per trade. Accounts growing beyond $300,000 reduce this to 1.5%, while accounts exceeding $1 million maintain risk between 0.5-1%.
Account SizeMaximum Risk per Trade
Under $50K
3%
$50K-$300K
2%
Over $300K
1.5%
Over $1M
0.5-1%
Stop Loss Placement Techniques
Note that stop losses should never be placed directly at support or resistance levels. We implement these proven techniques:
- Set stops a distance from S&R using Average True Range (ATR)
- Wait for candle closure beyond S&R levels
- Think about volatility when determining stop width
- Place stops behind recent swing highs/lows
Support and resistance levels often serve as prime locations for stop hunting. This is why we position our stops at a calculated distance from these levels, typically using 1.5 to 2 times the ATR value.
Managing Multiple Time Frame Conflicts
Trading across multiple timeframes creates unique challenges. We have analyzed S&R levels that require at least three timeframes. When conflicts arise between timeframes, we prioritize:
- Higher timeframe levels take precedence
- Volume confirmation at key levels
- Price action validation
- Trend alignment across timeframes
Support and resistance work best to define entry and exit points, among other risk management settings. Through careful position sizing and strategic stop placement, traders maintain control over risk exposure while maximizing potential returns.
These risk management strategies help traders protect their capital while capturing major market moves. Success comes from balancing aggressive trading with prudent risk controls, as capital preservation always takes priority over potential profits.
Psychological Aspects of S&R Trading
The psychological dimension of trading determines success more than technical analysis skills. We have found that mastering emotions at support and resistance levels gives traders a clear edge in the market.
Maintaining Discipline at Key Levels
Emotional control at vital price levels challenges even experienced traders. Market psychology plays a major role because traders act on past experiences and respond to market conditions. Zones of resistance and support reveal themselves through market participants' collective sentiment.
These emotional states emerge at support and resistance levels:
- Optimism when price bounces from support
- Uncertainty during consolidation phases
- Anxiety when approaching key resistance
- Relief after successful breakouts
A winning trader must be disciplined. Our experience shows that controlling impulses and emotions needs a well-laid-out approach to decision-making.
Handling Failed Breakouts
Failed breakouts create some of the most challenging psychological tests. The market shows what we call "anchoring" - a behavioral pattern where traders unconsciously use irrelevant information as fixed reference points for decisions.
Emotional ChallengeManagement Strategy
Fear of Missing Out
Wait for confirmation
Revenge Trading
Step away temporarily
Analysis Paralysis
Follow pre-set rules
Overconfidence
Review past failures
Traders who are already long often wait for price to climb back to previous support levels after a failed breakout to limit their losses. This psychological tendency creates self-fulfilling prophecies in the market.
Building Confidence in Your Analysis
Building confidence begins with accepting that losses are natural in trading. The best antidote to uncertainty comes from building psychological energy through:
- Regular performance evaluation
- Systematic trade documentation
- Continuous market education
- Proper rest and relaxation
A user-friendly feel of the markets develops with practice. We maintain this natural perception by filtering negative self-talk and challenging unproductive thoughts. Successful traders know that price charts show timelines of optimism and pessimism. Emotional discipline remains vital for consistent success.
Trading needs more than luck - it demands consistent effort, research, and a willingness to learn from mistakes. A focus on these elements while keeping emotional balance creates foundations for sustainable trading success at key support and resistance levels.
Conclusion
Support and resistance trading requires you to become skilled at technical analysis and master your emotions. Our detailed exploration shows how professional traders blend different analytical methods to spot and trade these significant price levels.
Successful traders stand out because they know how to use advanced indicators, integrate platforms, recognize patterns, and manage risks. Of course, keeping emotions in check matters just as much as technical analysis to generate consistent profits.
Professional traders excel by:
- Looking at multiple timeframes at once
- Confirming trades with volume analysis
- Following strict risk management rules
- Staying calm at critical price points
- Spotting hidden patterns and fractals
Success in support and resistance trading needs a balanced mindset. Technical analysis provides structure, while emotional readiness helps you execute trades properly. On top of that, regular practice and learning help you develop an accessible interface to spot high-probability trades.
The quickest way to trade support and resistance levels combines these elements into one strategy while keeping emotions in check. This integrated approach with solid risk management forms the foundations of lasting trading success.
Summary
Customer reviews
5 | 33 % | |
4 | 67 % | |
3 | 0 % | |
2 | 0 % | |
1 | 0 % |


!["[Hamster-Coder] Moving Average MTF" logo](https://cdn.ctrader.com/image/webp/b11b98b1-194d-4b8e-b00e-d611826ad159_31226)


