Area of Interest

23/08/2025
2
Desktop
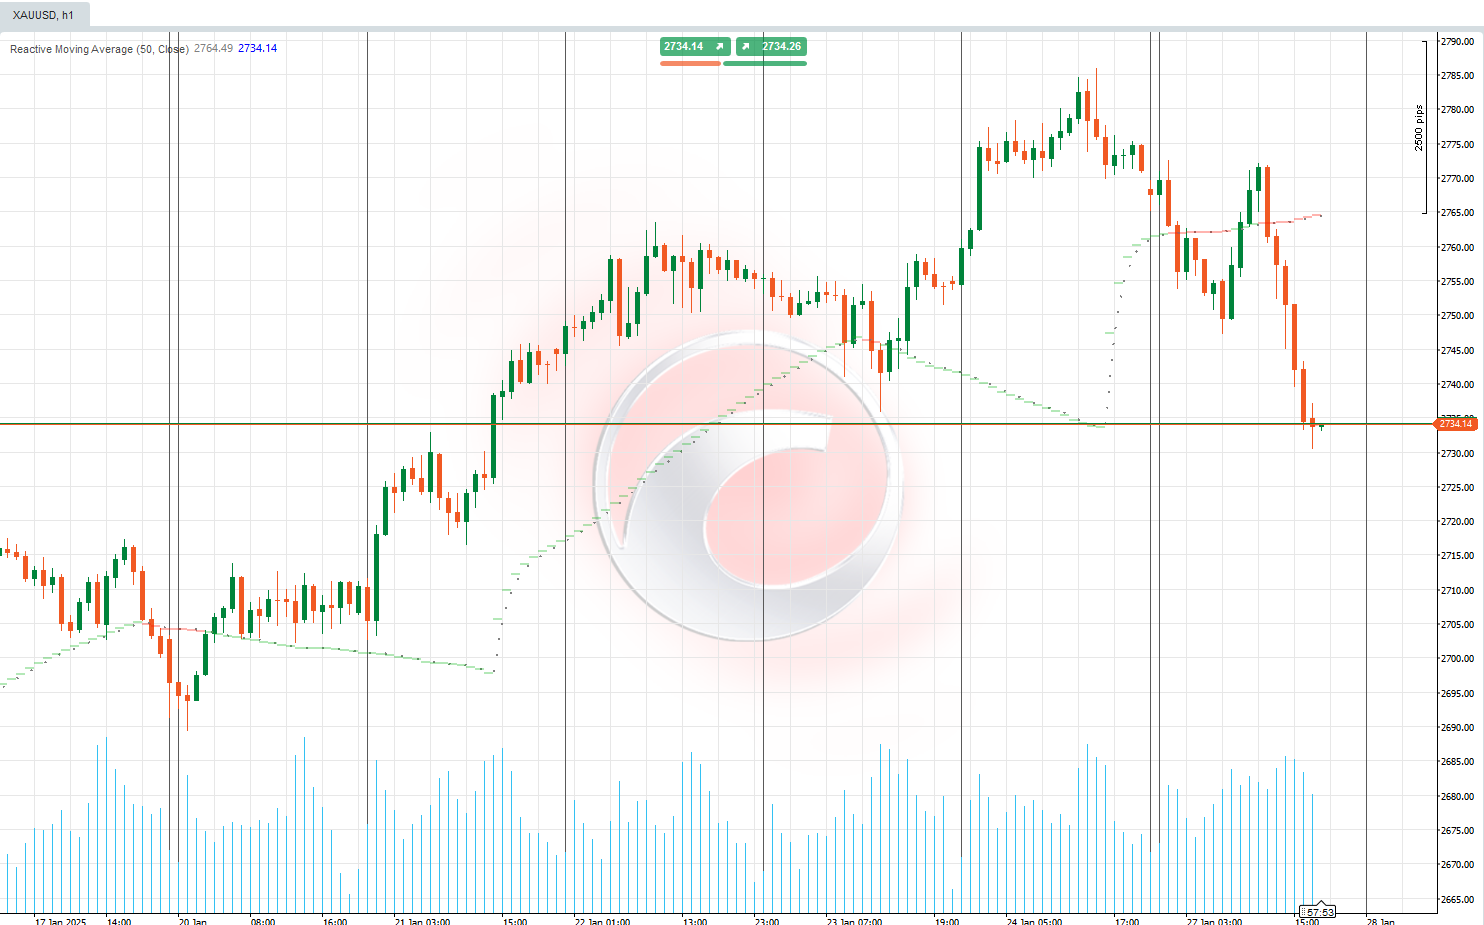
1. Purpose of the Indicator
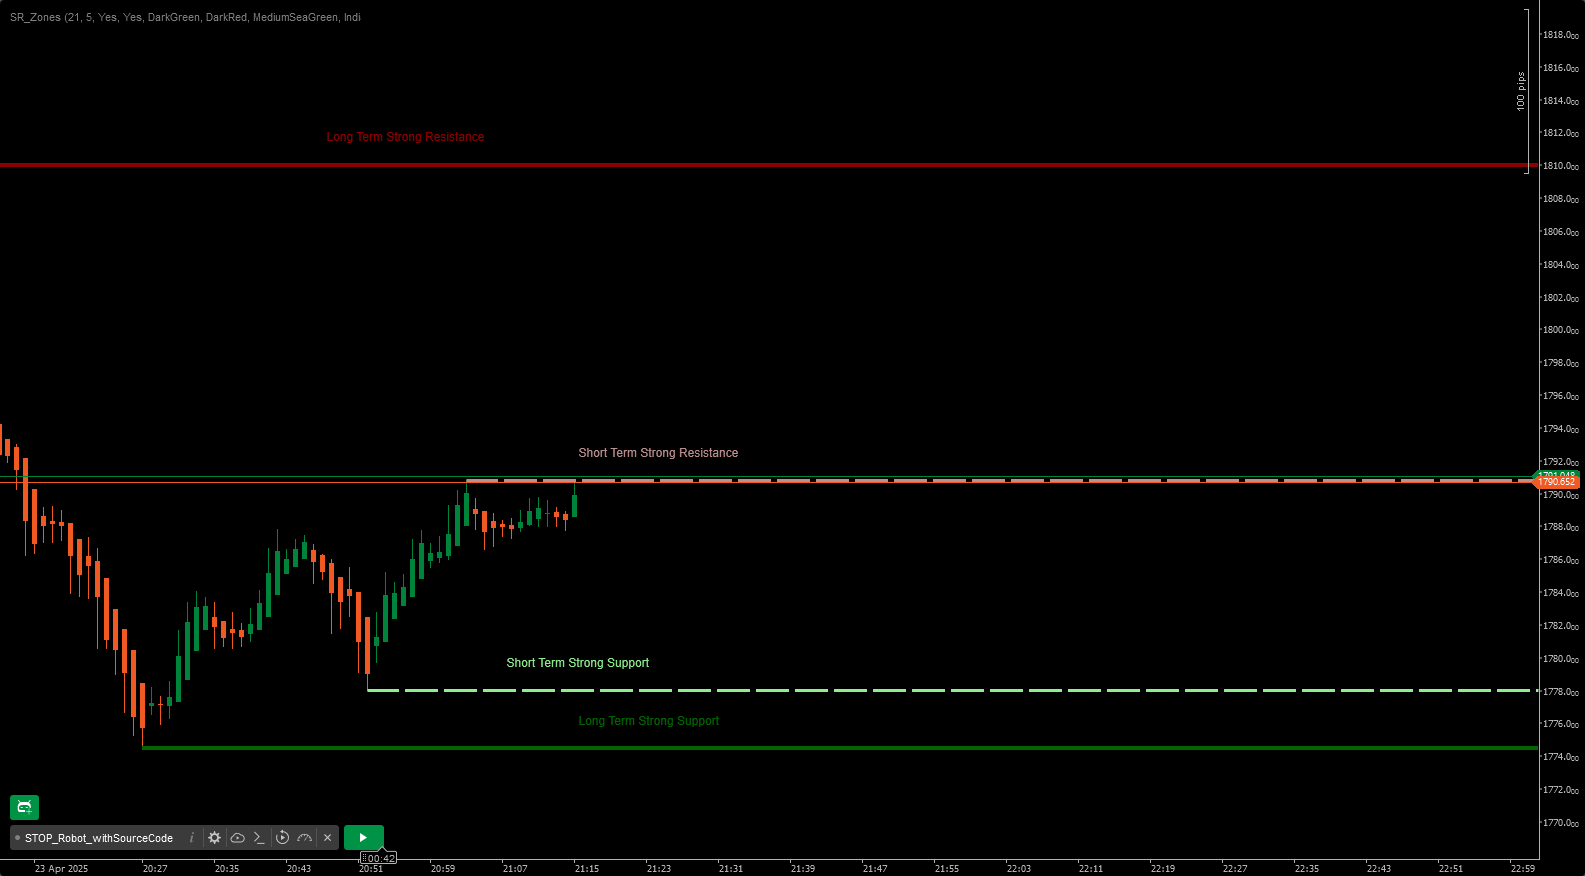
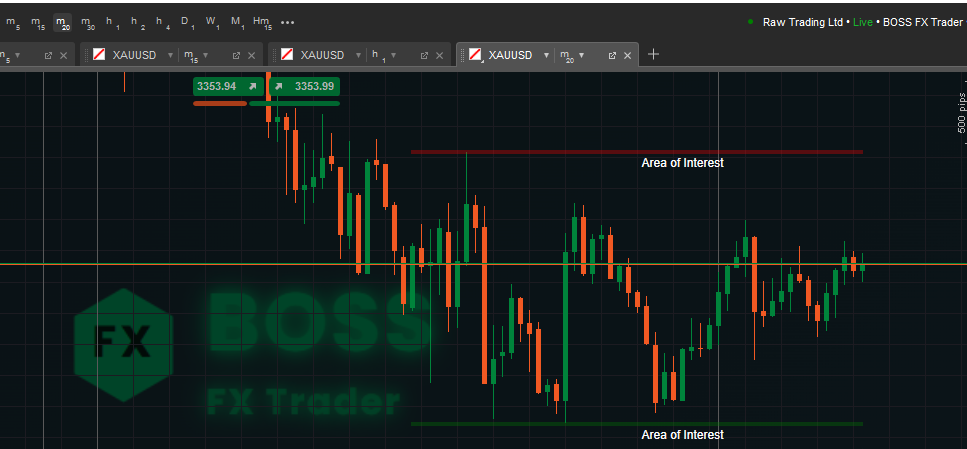
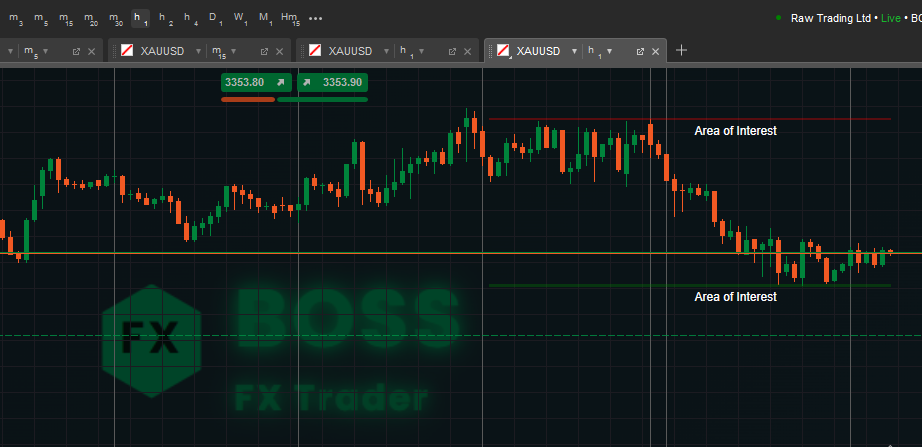
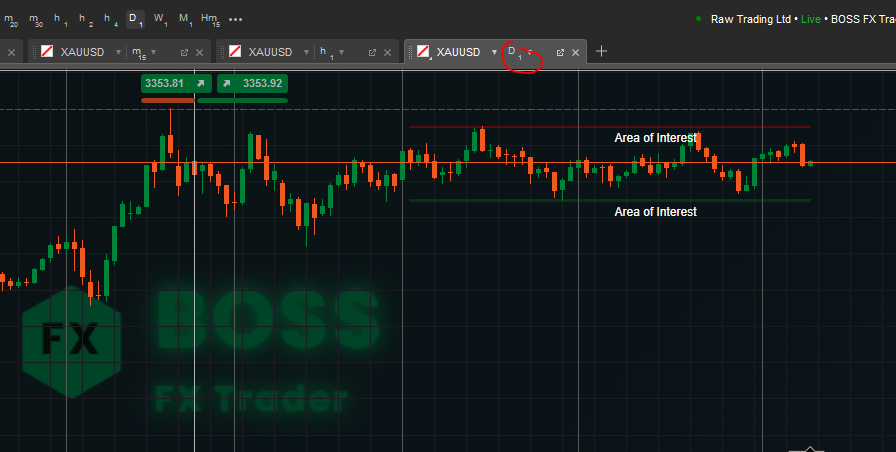
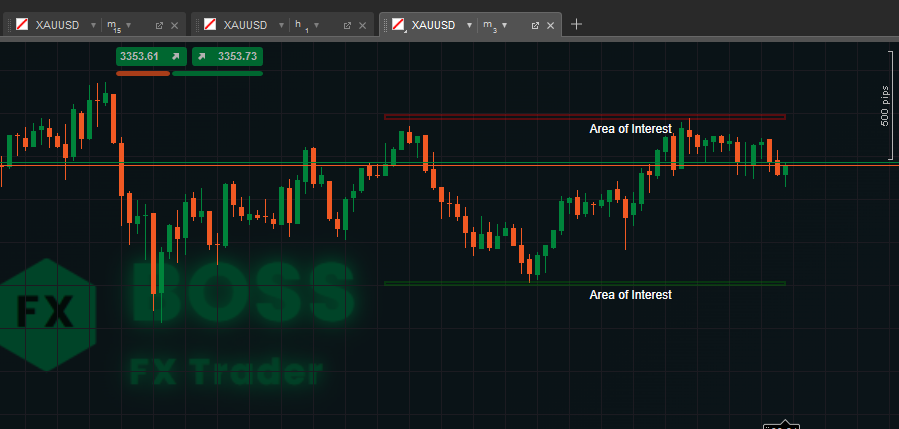
This Area of Interest cTrader indicator identifies support and resistance zones within a user-defined lookback period, and visually highlights them as “Areas of Interest” on your chart.
It helps traders quickly see key price levels where reversals or breakouts are more likely to occur.
2. How the Code Works
- Lookback Period – The number of previous bars (candles) the indicator will scan to find the highest high and lowest low.
- Higher values → broader zones.
- Lower values → more recent levels.
- Zone Height – The vertical size (thickness) of the support/resistance area in pips.
- Helps make the zone more visible and adjustable.
- Clears old drawings before plotting new ones to avoid clutter.
- Collects high and low prices for the lookback range.
- Finds the highest and lowest price levels (resistance & support).
- Converts zone height from pips to actual price value.
3. Usage Instructions
- Attach the Indicator
- Open cTrader, load a chart, click Indicators → Custom → AreaOfInterest.
- Adjust Parameters
- Lookback Period:
- For swing trading → Use larger values (e.g., 100–200).
- For scalping → Use smaller values (e.g., 20–50).
- Zone Height: Adjust to your trading style and instrument volatility.
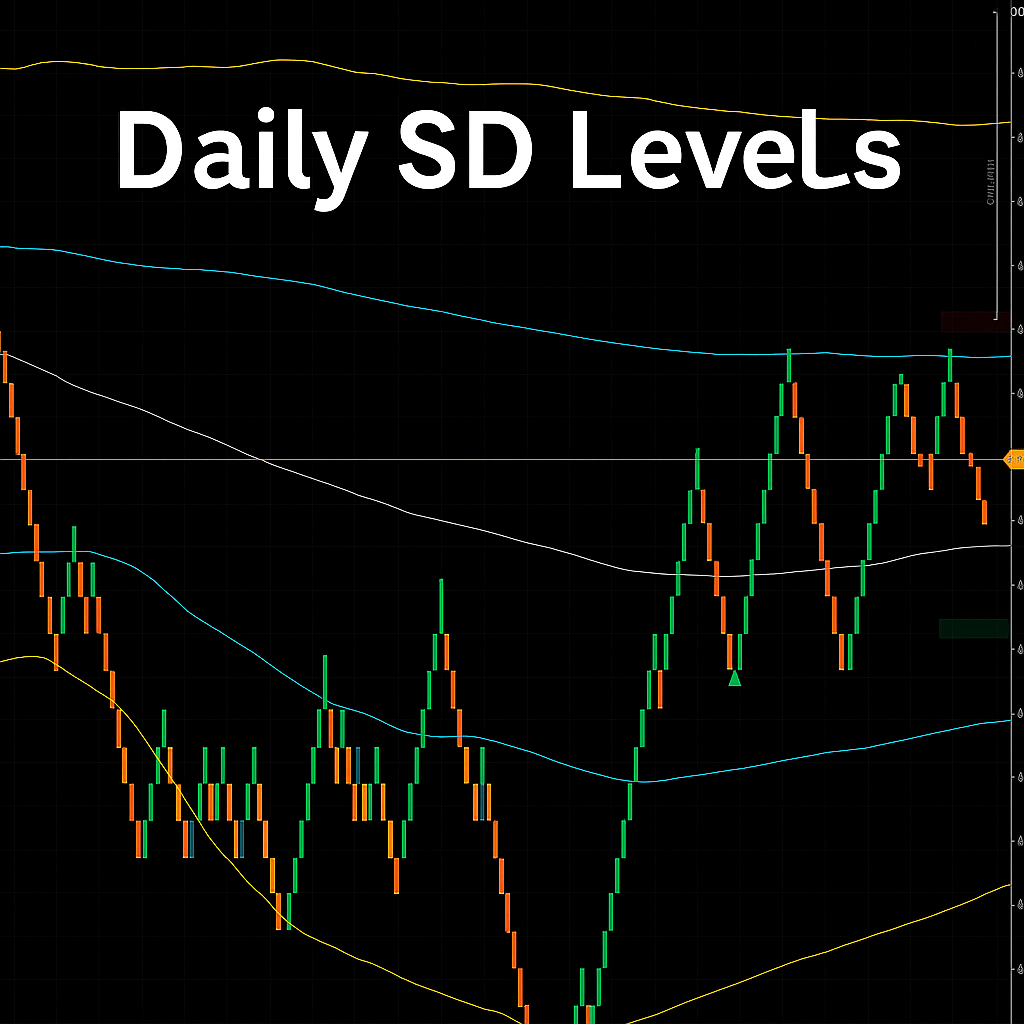
- Interpreting the Zones
- Red Zone (Resistance) – Price tends to reverse or slow down when entering this zone.
- Green Zone (Support) – Price often bounces upward from here.
- Look for:
- Price rejection
- Candlestick patterns (pin bars, engulfing)
- Confluence with other indicators (EMA, RSI, Fibonacci)
- Trading Examples
- Bounce Trade: Enter long near the green zone with a stop just below it.
- Breakout Trade: Wait for prices to close above the red zone for a bullish breakout.
- False Break Detection: Watch for wicks beyond the zone but closed inside (possible reversals).
A profitable trader used this tool.
More from this author


Indicator
Forex
SpreadCalculator - BossFXTrader
Spread Calculator to calculate the difference between two prices or values.
You may also like


Indicator
ATR
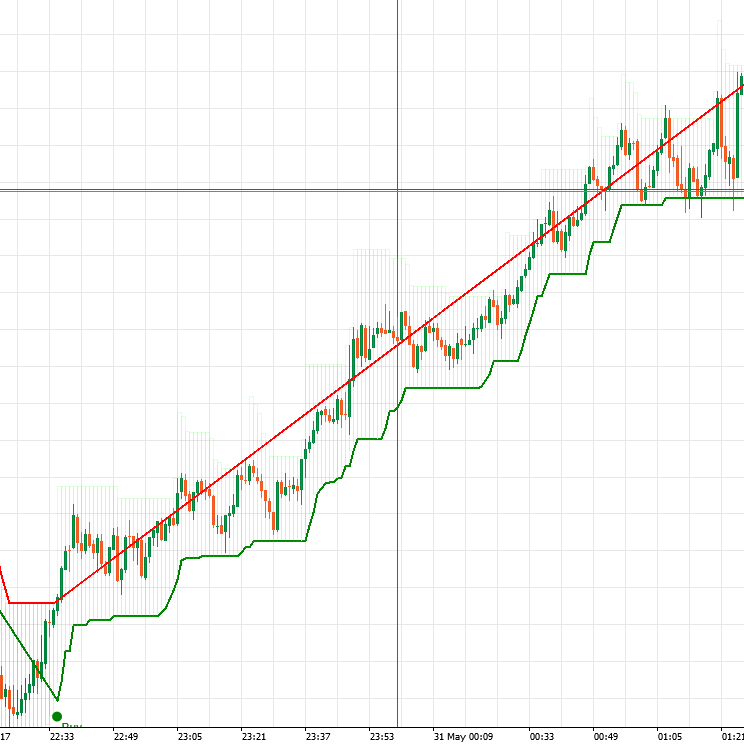
SmartBot-Tenkan & ATR Indicator
The Tenkan-ATR Indicator is a powerful and innovative indicator for Traders. SALE OFF!!!
.jpg)
Indicator
RSI
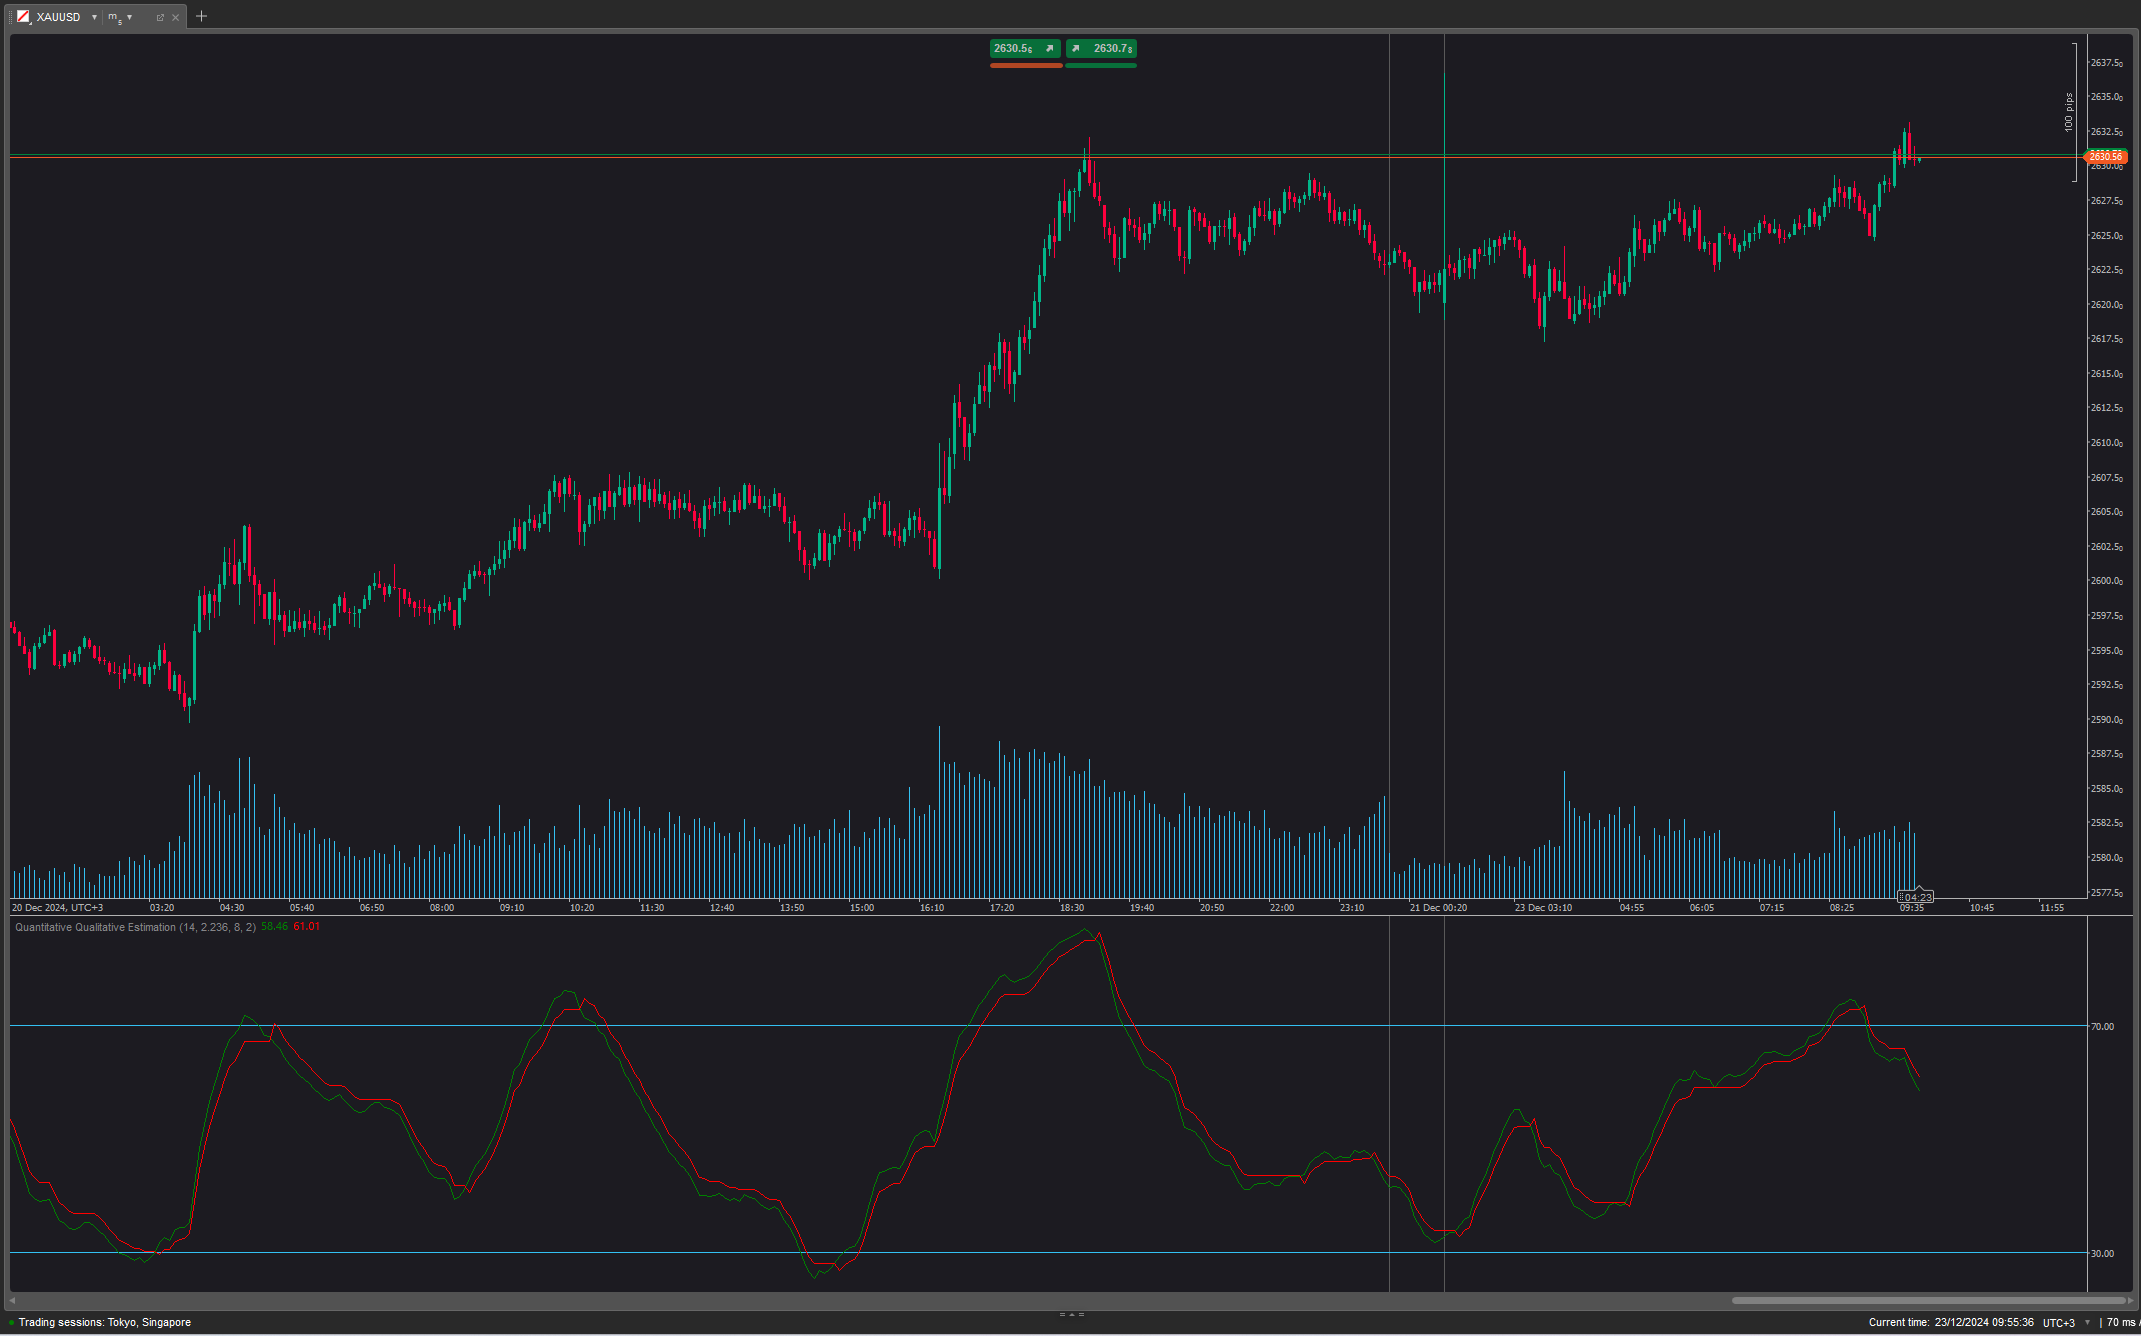
Quantitative Qualitative Estimation
The QQE (Quantitative Qualitative Estimation) Weighted Oscillator improves its original version by weighting the RSI.
Indicator
Forex
SpreadCalculator - BossFXTrader
Spread Calculator to calculate the difference between two prices or values.