Candles_Painter

21/08/2025
2
Desktop
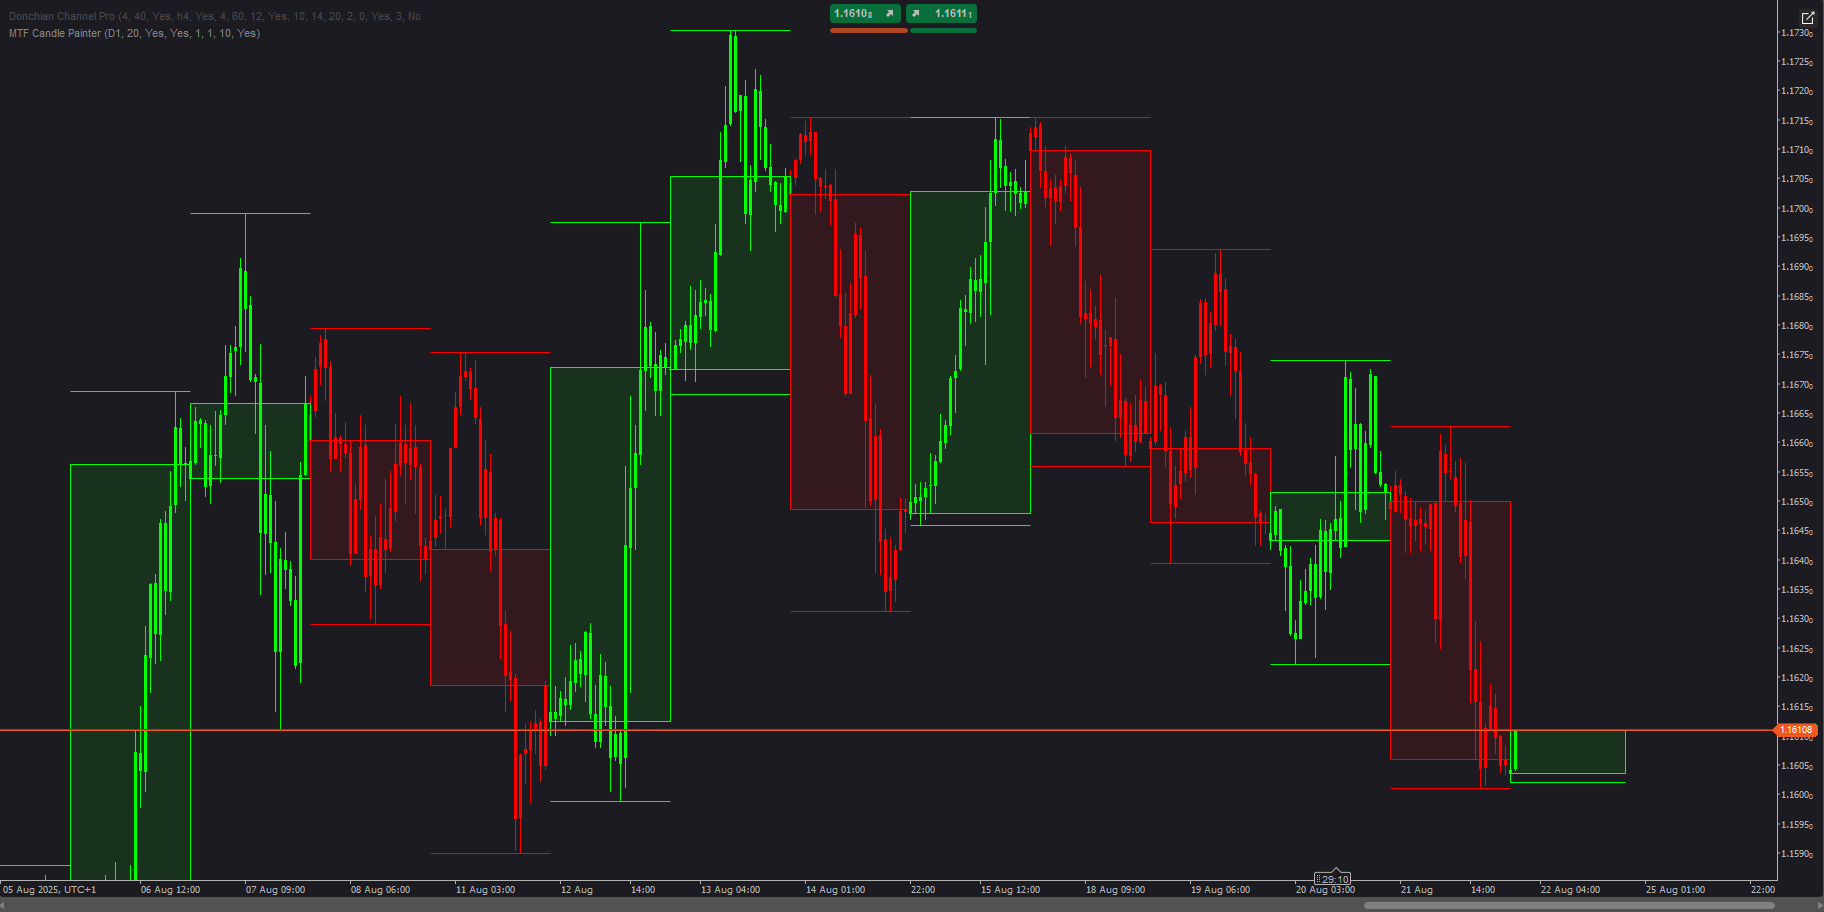
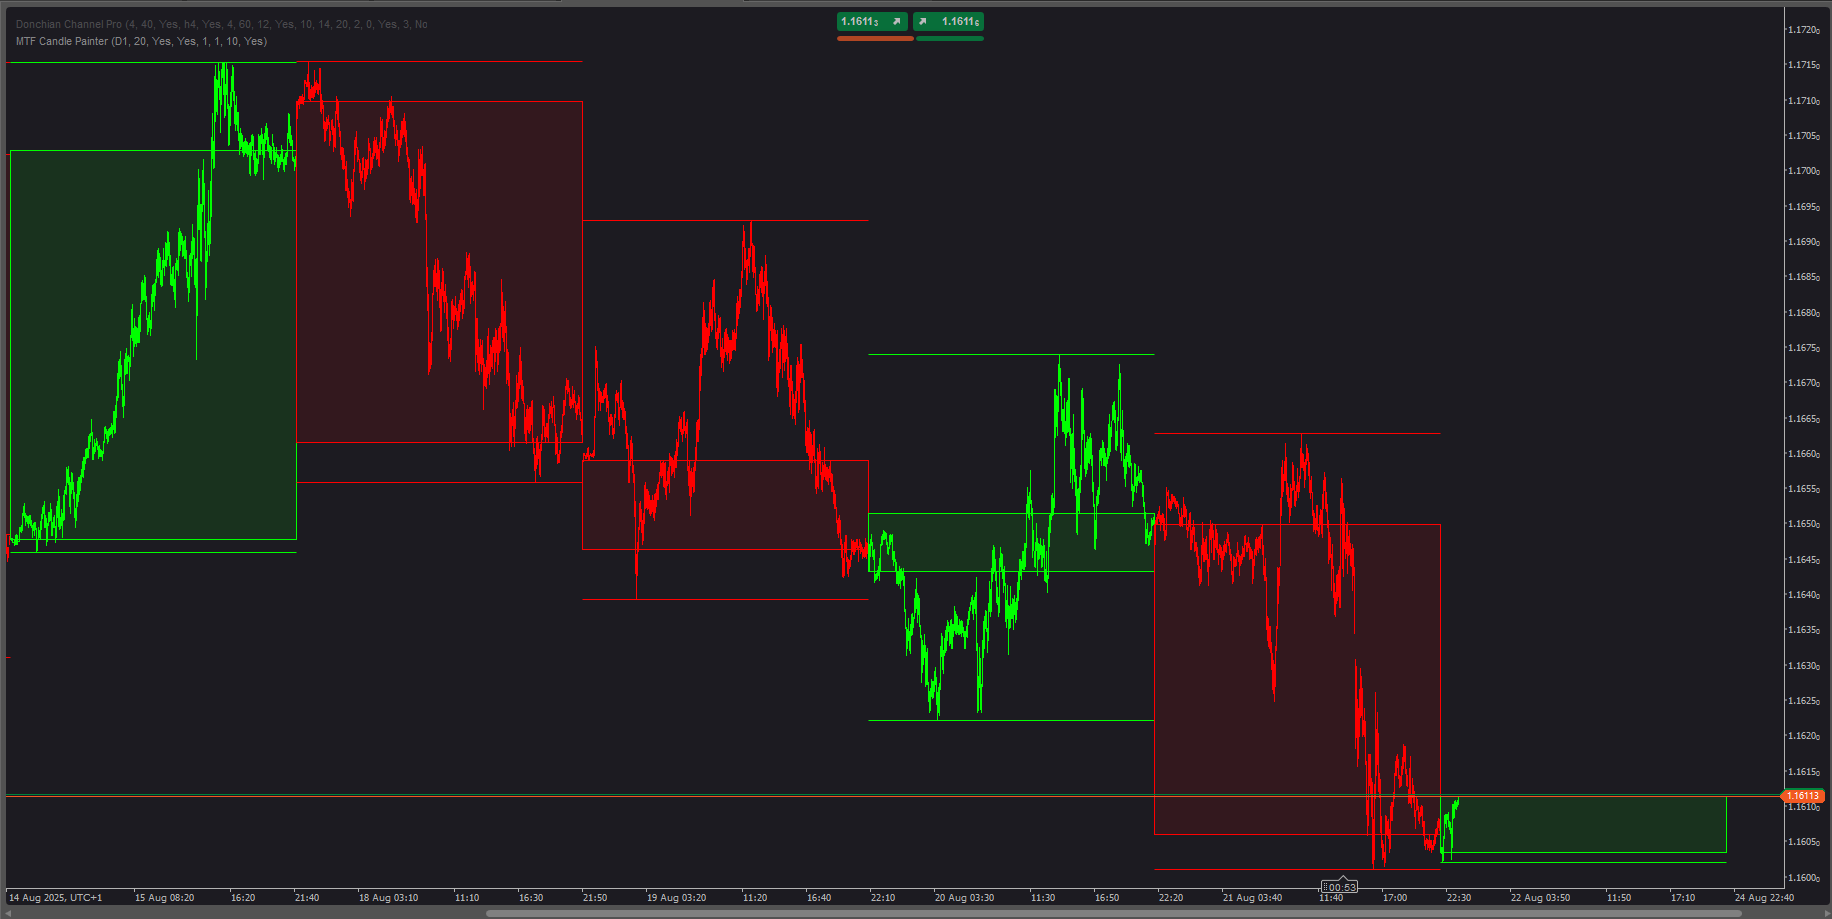
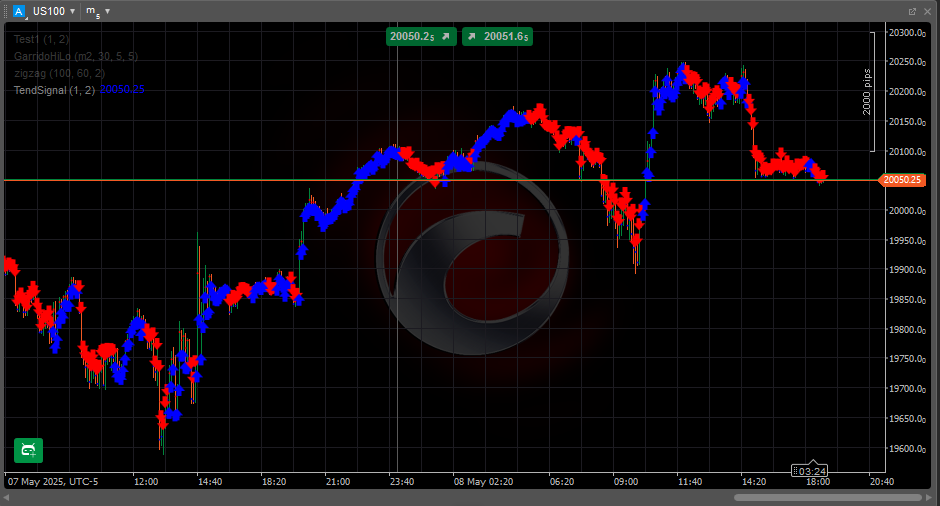
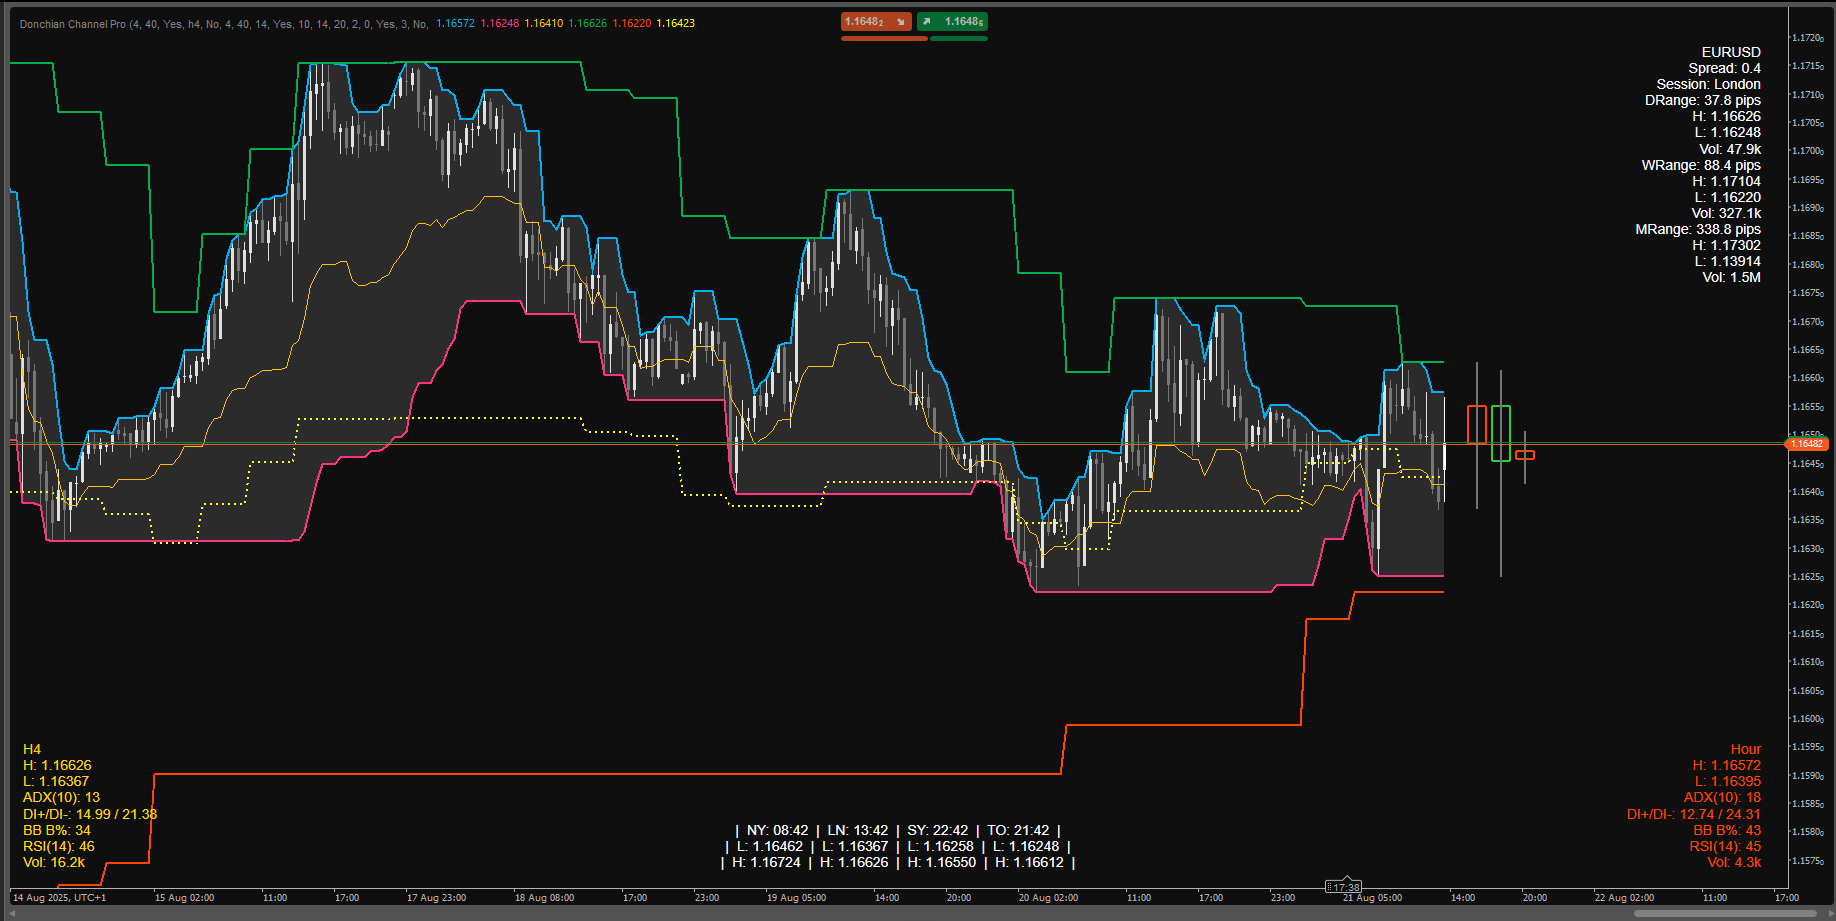
MTF Candle Painter overlays the higher timeframe (HTF) context directly on your current chart. It colors every bar on the active timeframe by the direction of the enclosing HTF candle and draws a filled HTF body rectangle (open–close only, no wicks) plus optional HTF High/Low lines. Separate bull/bear colors and adjustable fill opacity give a clean, readable bias at a glance.
Key Features
- Multi-timeframe bar coloring: all bars inside an HTF candle inherit its bullish/bearish color.
- HTF body overlay: rectangle between HTF open and close; no middle wick for clarity.
- Separate bull/bear styling: independent outline and fill colors for bullish and bearish HTF candles.
- Adjustable opacity: set fill transparency (default 10%) for neat stacking with price.
- HTF High/Low lines: optional, with configurable thickness.
- Lookback control: choose how many recent HTF candles to render (default 20).
- Lightweight: uses native chart objects; fast and unobtrusive.
Parameters
Core
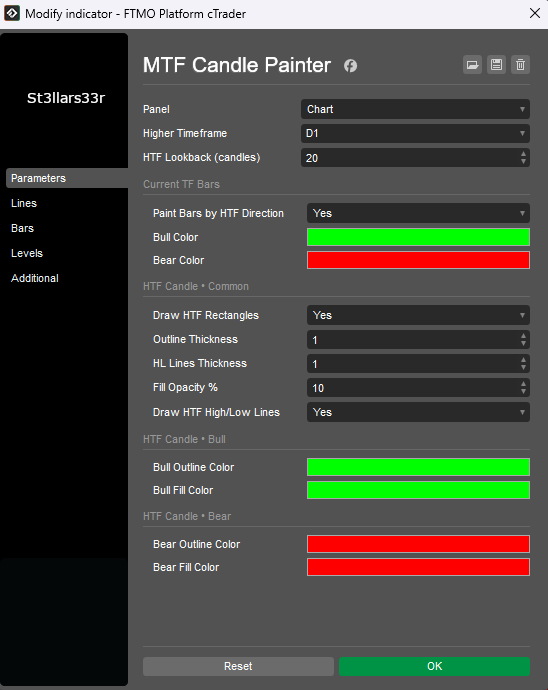
Higher Timeframe– HTF to overlay (e.g., D1, H4, W1).HTF Lookback (candles)– how many HTF candles to draw (default 20).
Current TF Bars
Paint Bars by HTF Direction– color current-TF bars by the enclosing HTF candle (Yes/No).Bull Color/Bear Color– colors for current-TF bars.
HTF Candle • Common
Draw HTF Rectangles– show HTF body rectangles (default Yes).Outline Thickness– HTF body outline thickness.HL Lines Thickness– thickness of HTF High/Low lines.Fill Opacity %– transparency of HTF body fill (default 10%).Draw HTF High/Low Lines– toggle HTF High/Low lines (Yes/No).
HTF Candle • Bull
Bull Outline Color– outline color for bullish HTF candles.Bull Fill Color– fill color for bullish HTF candles.
HTF Candle • Bear
Bear Outline Color– outline color for bearish HTF candles.Bear Fill Color– fill color for bearish HTF candles.
Who It’s For
- Intraday traders and scalpers who need continuous HTF bias without switching charts.
- SMC/Wyckoff practitioners who rely on higher-timeframe structure while executing on lower TFs.
- Anyone who wants a clean, visual HTF context layered on their working timeframe.
More from this author
You may also like

 w.jpg)