Get cTrader
Start trading
cBots
Indicators
Plugins
Brokers & Props
Indicator
Bollinger
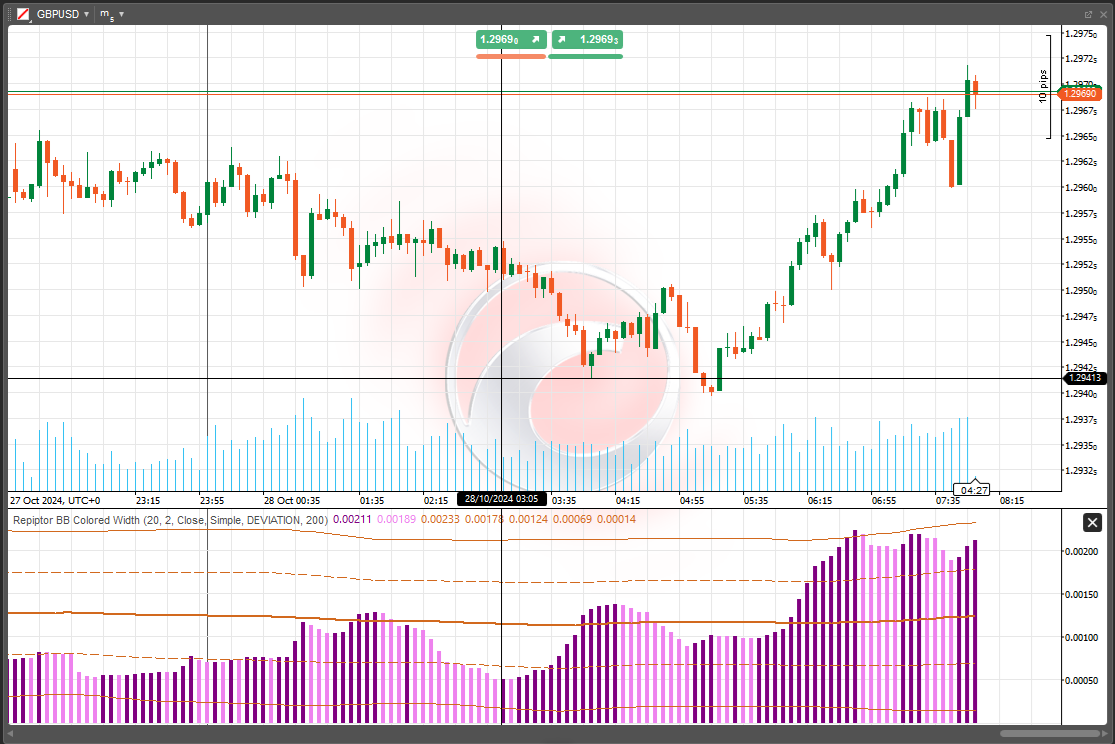
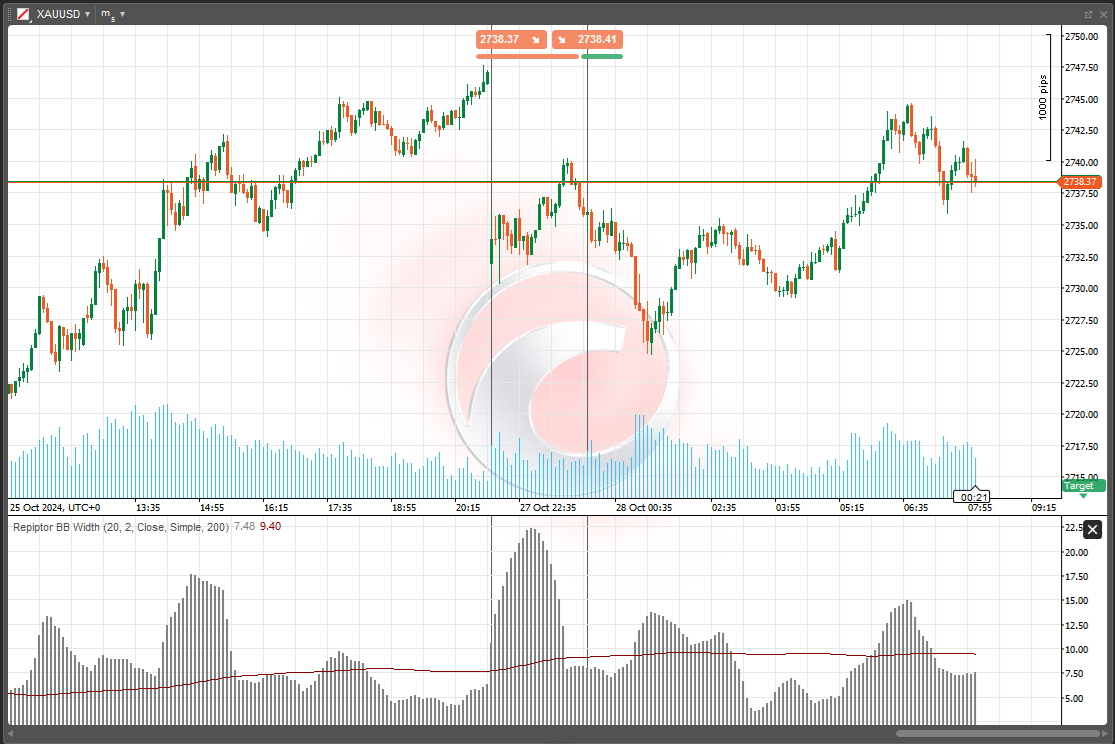
Repiptor BB Width
Share
03/09/2025
59
Desktop
repiptor
Since 26/10/2024
Free installs
856
Description
Customer reviews
Bollinger Bands Width with dynamic average level
Expand
More from this author
Repiptor Candlescope Lite
repiptor
5.0
(1)
Free
Indicator
Repiptor Candlescope Lite
Candlestick pattern detector lite version
Free
Repiptor RSI Amplified
repiptor
5.0
(1)
Free
Indicator
RSI
Repiptor RSI Amplified
RSI Amplified
Free
Repiptor BB Colored Width
repiptor
5.0
(1)
Free
Indicator
Bollinger
Repiptor BB Colored Width
Colored Bollinger Bands Width
Free
You may also like
Popular
VegaXLR - ZigZag Alerts
vegaxlr
$ 20
Indicator
Forex
VegaXLR - ZigZag Alerts
cTrader ZigZag Alerts: Precision Swing Detection, Alerts, and Fibonacci.
$ 20
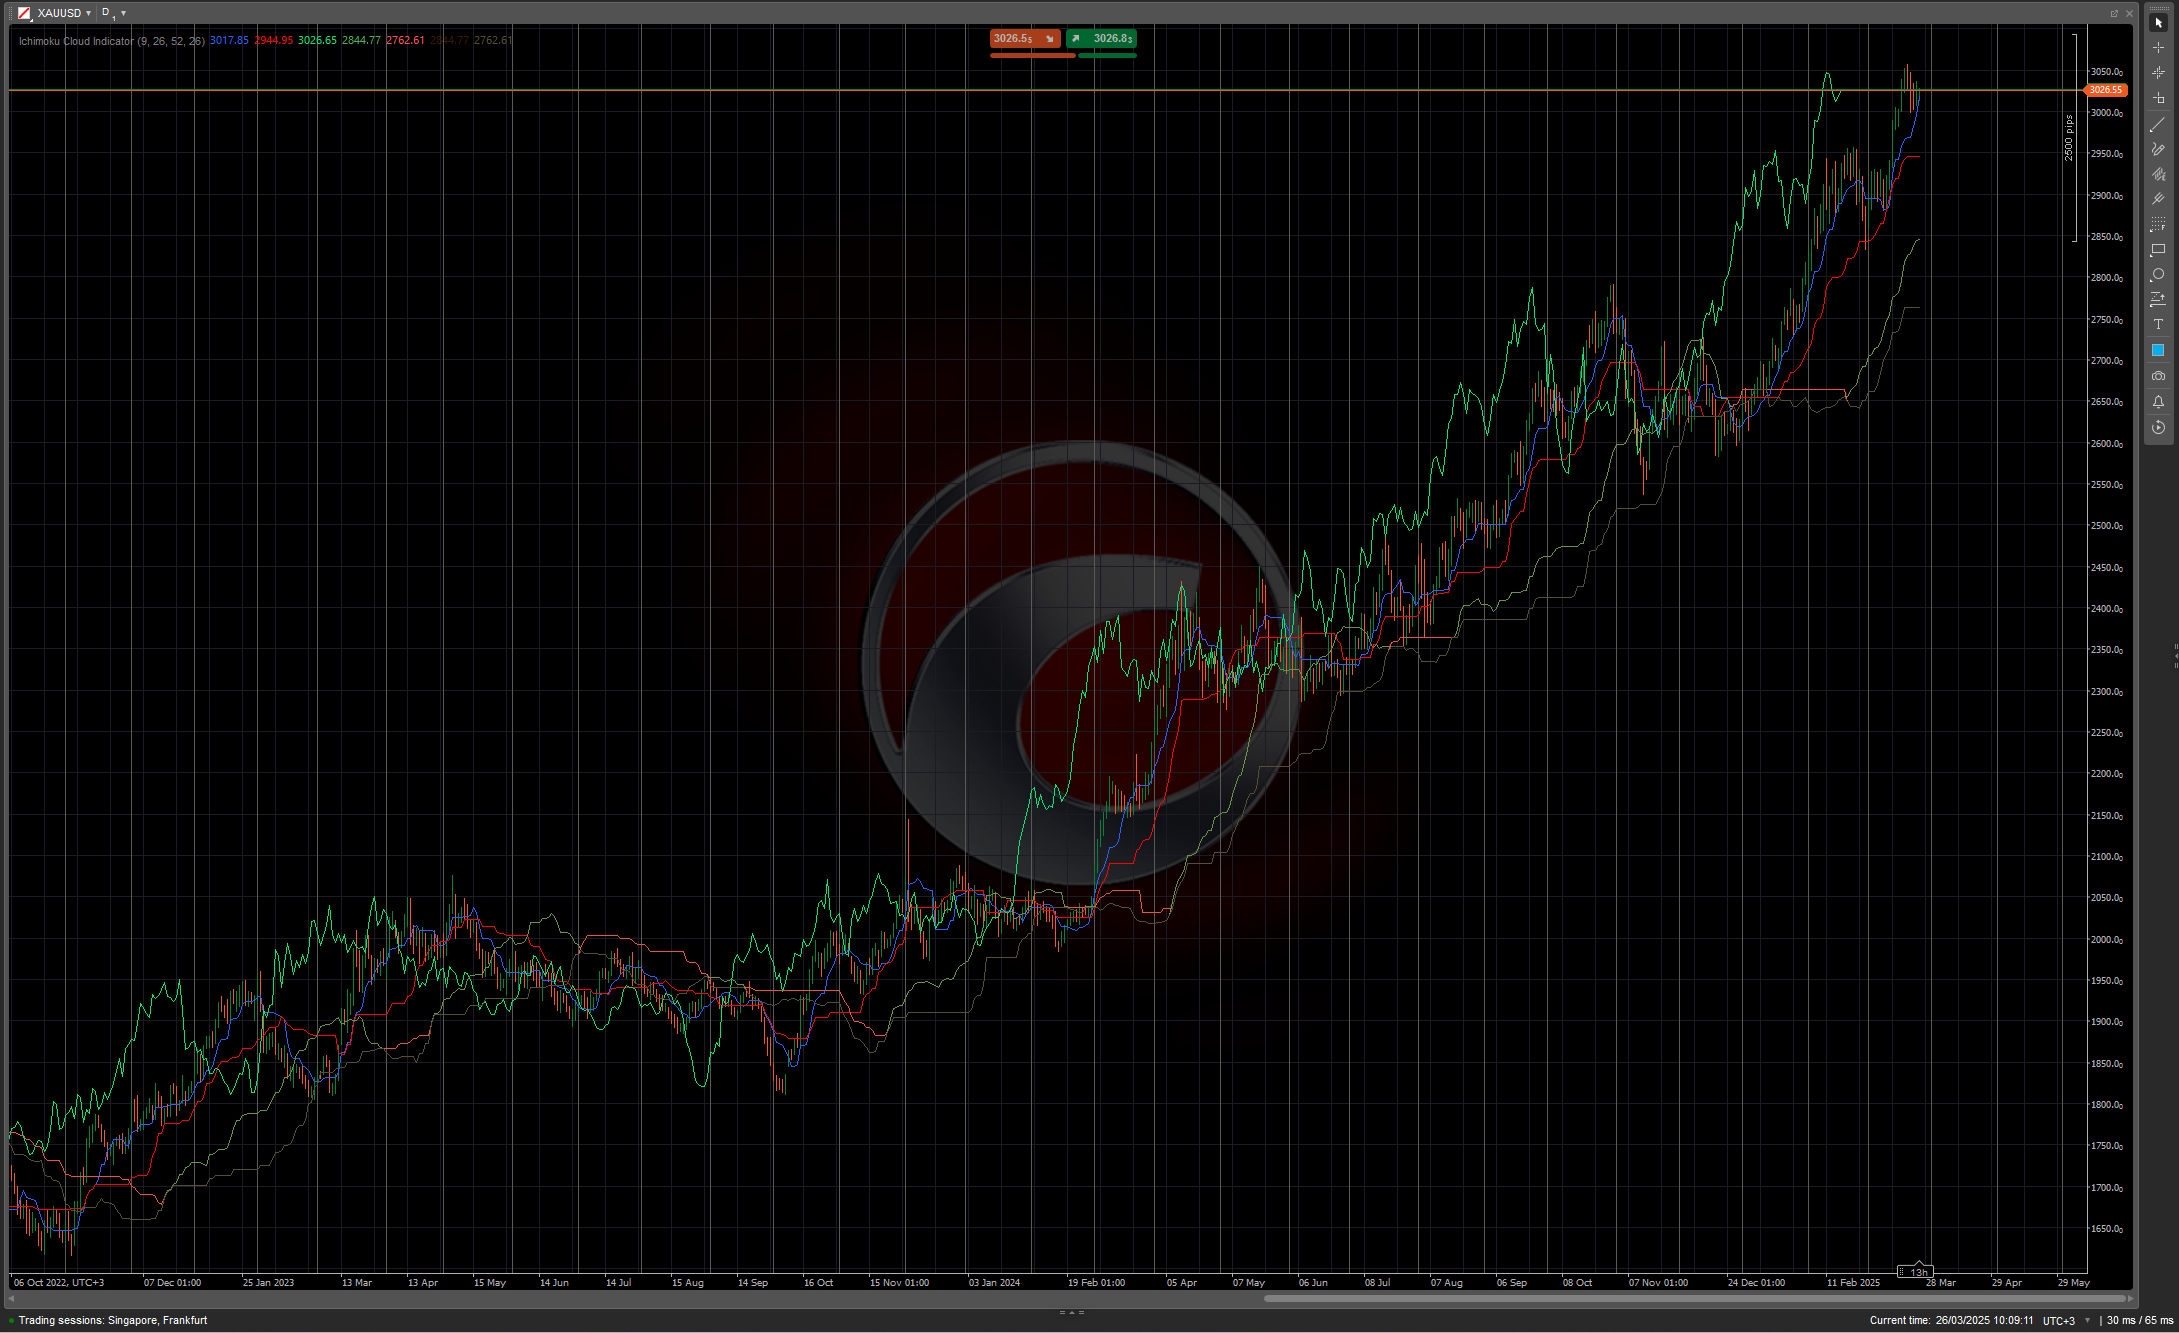
Ichimoku Cloud Indicator
Investion
Free
Indicator
Indices
Breakout
Stocks
+3
Ichimoku Cloud Indicator
The Ichimoku Cloud is a comprehensive technical analysis system developed by Japanese journalist Goichi Hosoda
Free
EconomicForex
Goulart
Free
Indicator
Forex
EURUSD
EconomicForex
ECONOMIC FOREX:provides insights into inflation, nominal interest rates and real interest rates, in the line chart
Free
Popular
Multi_TF Candlestick Chart Overlay
Dineshkumar_FX
$ 30
Indicator
Multi_TF Candlestick Chart Overlay
Perfect for traders who demand a clear overview of multiple timeframes at a glance.
$ 30
Popular
On Balance Volume USD - Combined
lifeofmichaeltrading
$ 10
Indicator
Signal
USDJPY
On Balance Volume USD - Combined
See USD demand in one line—Composite OBV fuses six major FX pairs into a clear momentum gauge.
$ 10
HTFBB
mage
$ 10
/
$15
Indicator
HTFBB
Plot higher-timeframe Bollinger Bands for clearer structure, pullback zones, and breakout signals—without switching char
$ 10
/
$15
Popular
Atlas Seasonal Returns Heatmap
Magnus.Blackstone
$ 15
/
$30
Indicator
NAS100
NZDUSD
XAUUSD
+10
Atlas Seasonal Returns Heatmap
🧭 See when your market tends to move—by Month, Day-of-Week, or Hour-of-Day🧭
$ 15
/
$30
Popular
Multi-Timeframe Market Levels
o.elmottaqy
5.0
(1)
$ 15
/
$30
Indicator
RSI
MACD
Multi-Timeframe Market Levels
Unlock market insights with our Multi-Timeframe Market Levels indicator, enhancing your trading strategies effortlessly
$ 15
/
$30
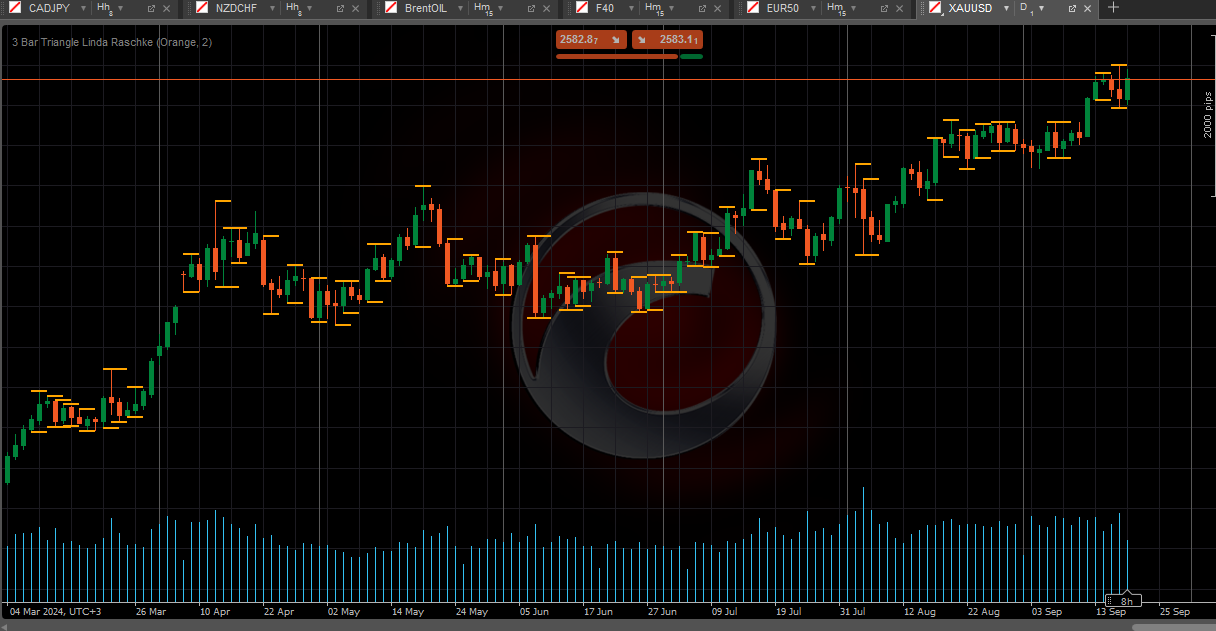
3 Bar Triangle by Linda Raschke
BestPriceFx
5.0
(1)
Free
Indicator
Breakout
3 Bar Triangle by Linda Raschke
3 bar triangle = high below 2 day high, low above 2 day low
Free
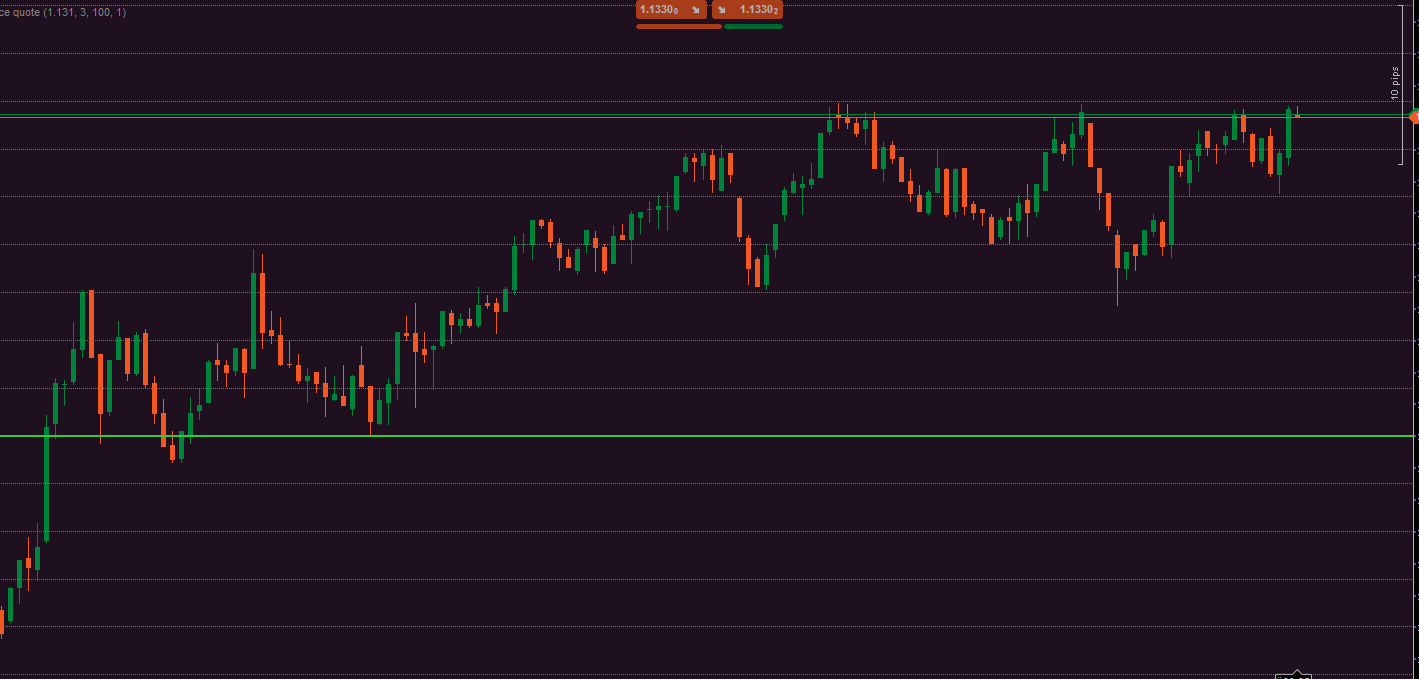
price quote
Felipe.SC97
Free
Indicator
price quote
price quote
Free
HTFOverlayPlus
Felipe.SC97
Free
Indicator
HTFOverlayPlus
HTFOverlayPlus
Free
Popular
Order Block
pinescriptlabs
5.0
(1)
$ 10
Indicator
RSI
XAUUSD
Breakout
+6
Order Block
Identify bullish and bearish Order Blocks to spot key support/resistance levels and potential trend reversals! 📈🔄
$ 10
MARainbow
algobotspro
$ 10
/
$17
Indicator
Indices
Commodities
Stocks
+2
MARainbow
MARainbow gives you the edge with four customizable moving averages—each color-coded for instant recognition.
$ 10
/
$17
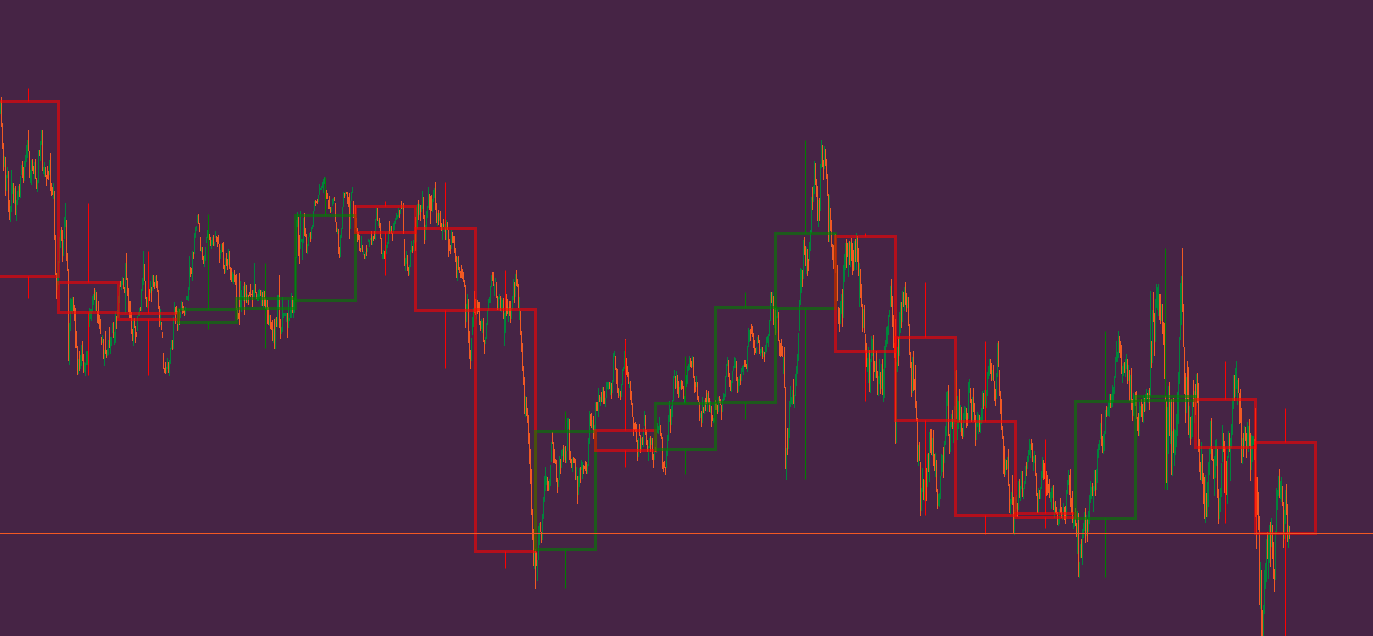
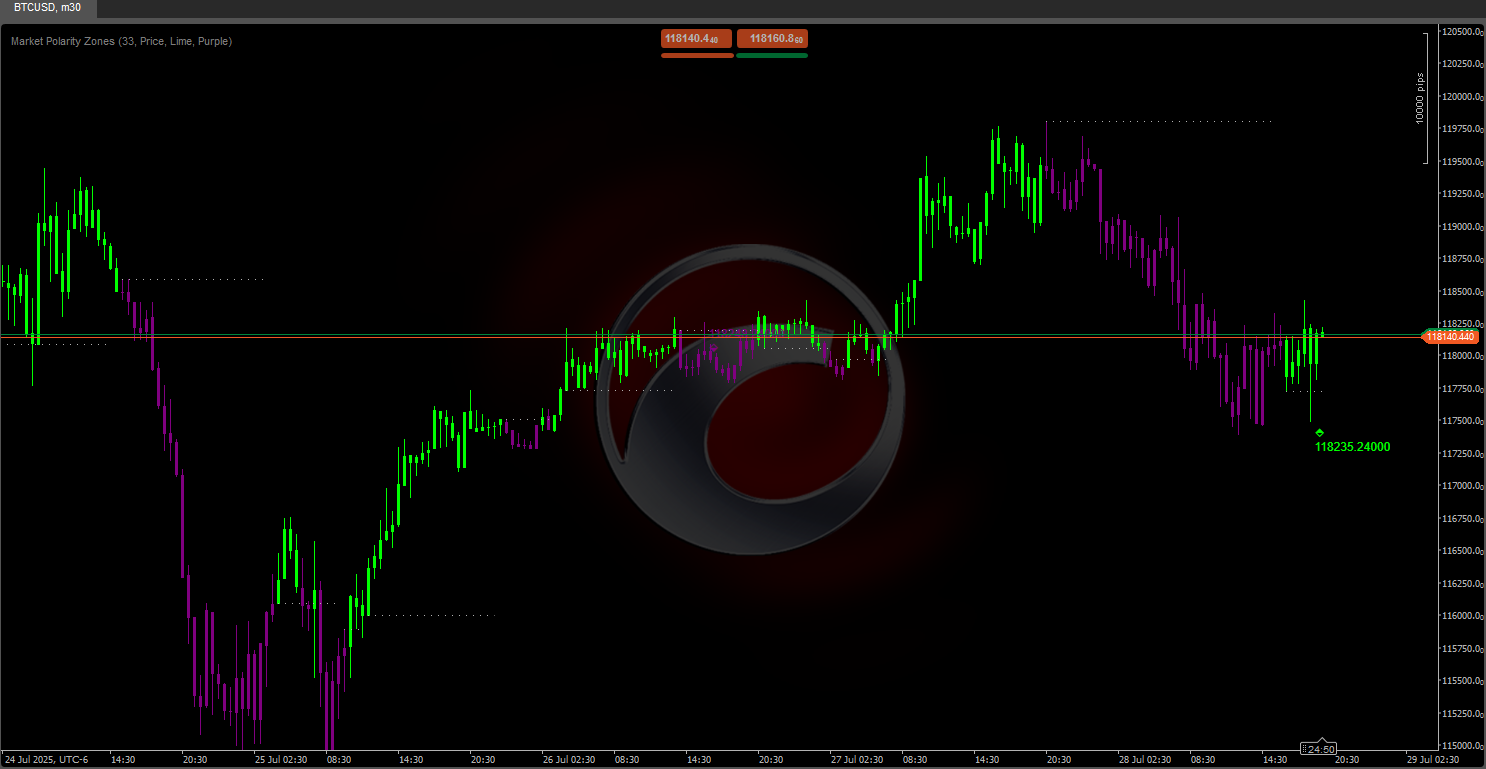
Market Polarity Zones
pinescriptlabs
Free
Indicator
Market Polarity Zones
implifies market analysis by automatically identifying bullish 🚀 or bearish 🐻 phases and marking key levels where ....
Free
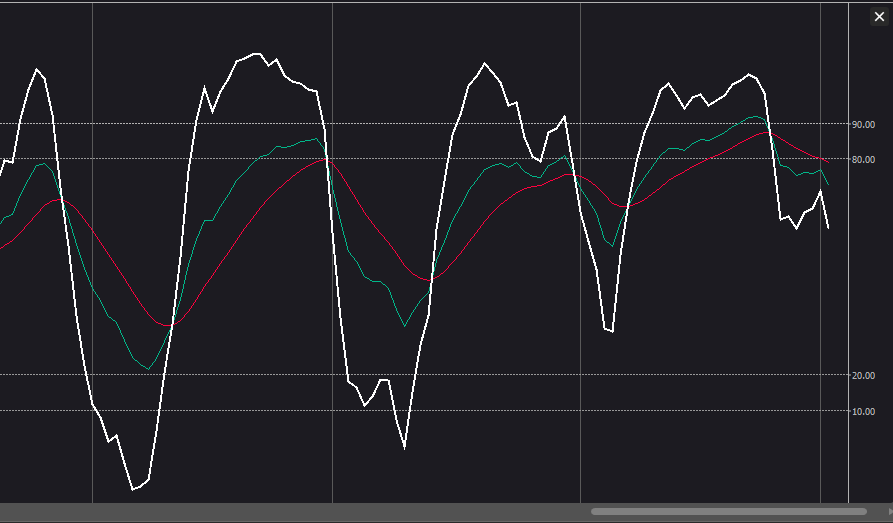
KDJ
Investion
5.0
(1)
Free
Indicator
KDJ
The KDJ oscillator display consists of 3 lines (K, D and J - hence the name of the display) and 2 levels.
Free
Top-rated
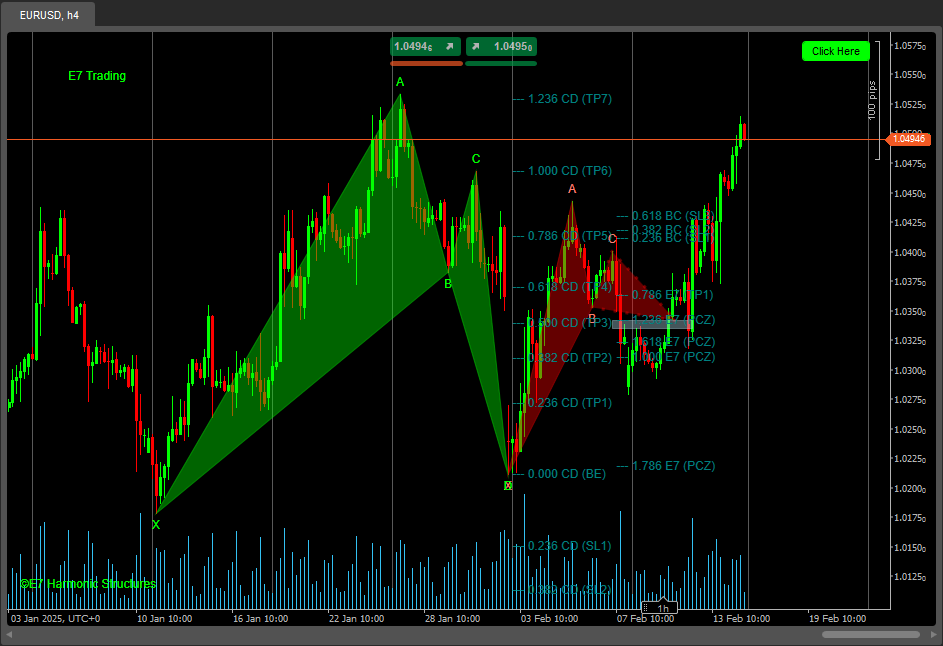
E7 Harmonic Structures Basic
Gwave
5.0
(2)
Free
Indicator
E7 Harmonic Structures Basic
E7 Harmonic Structures Basic.
Free
Popular
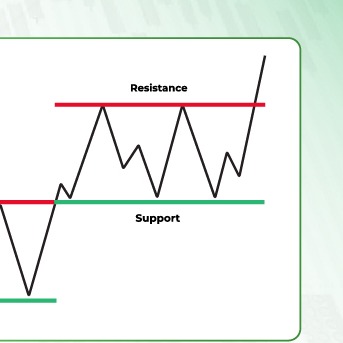
support and resistance
ShubhG
$ 10
Indicator
Breakout
Forex
support and resistance
Support and Resistance Line Indicator with Higher Timeframe Filter
$ 10
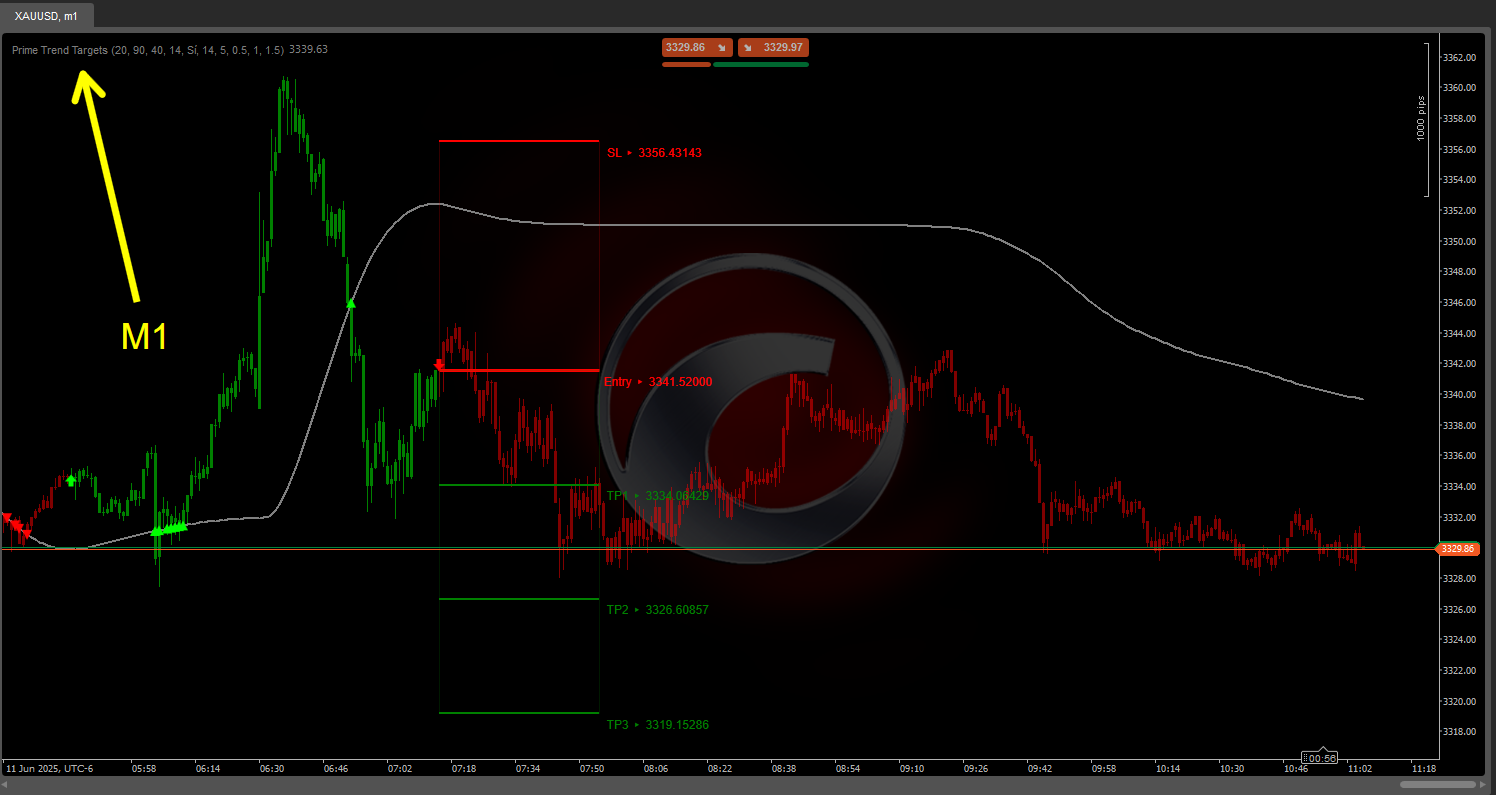
Prime Trend Targets
pinescriptlabs
Free
Indicator
RSI
XAUUSD
Breakout
+5
Prime Trend Targets
PrimeTrend: ATR trendline detects reversals, plots entry/SL/3 targets. Tune params (speed vs. robustness). Backtest +
Free
Load more