Get cTrader
Start trading
cBots
Indicators
Plugins
Brokers & Props
Indicator
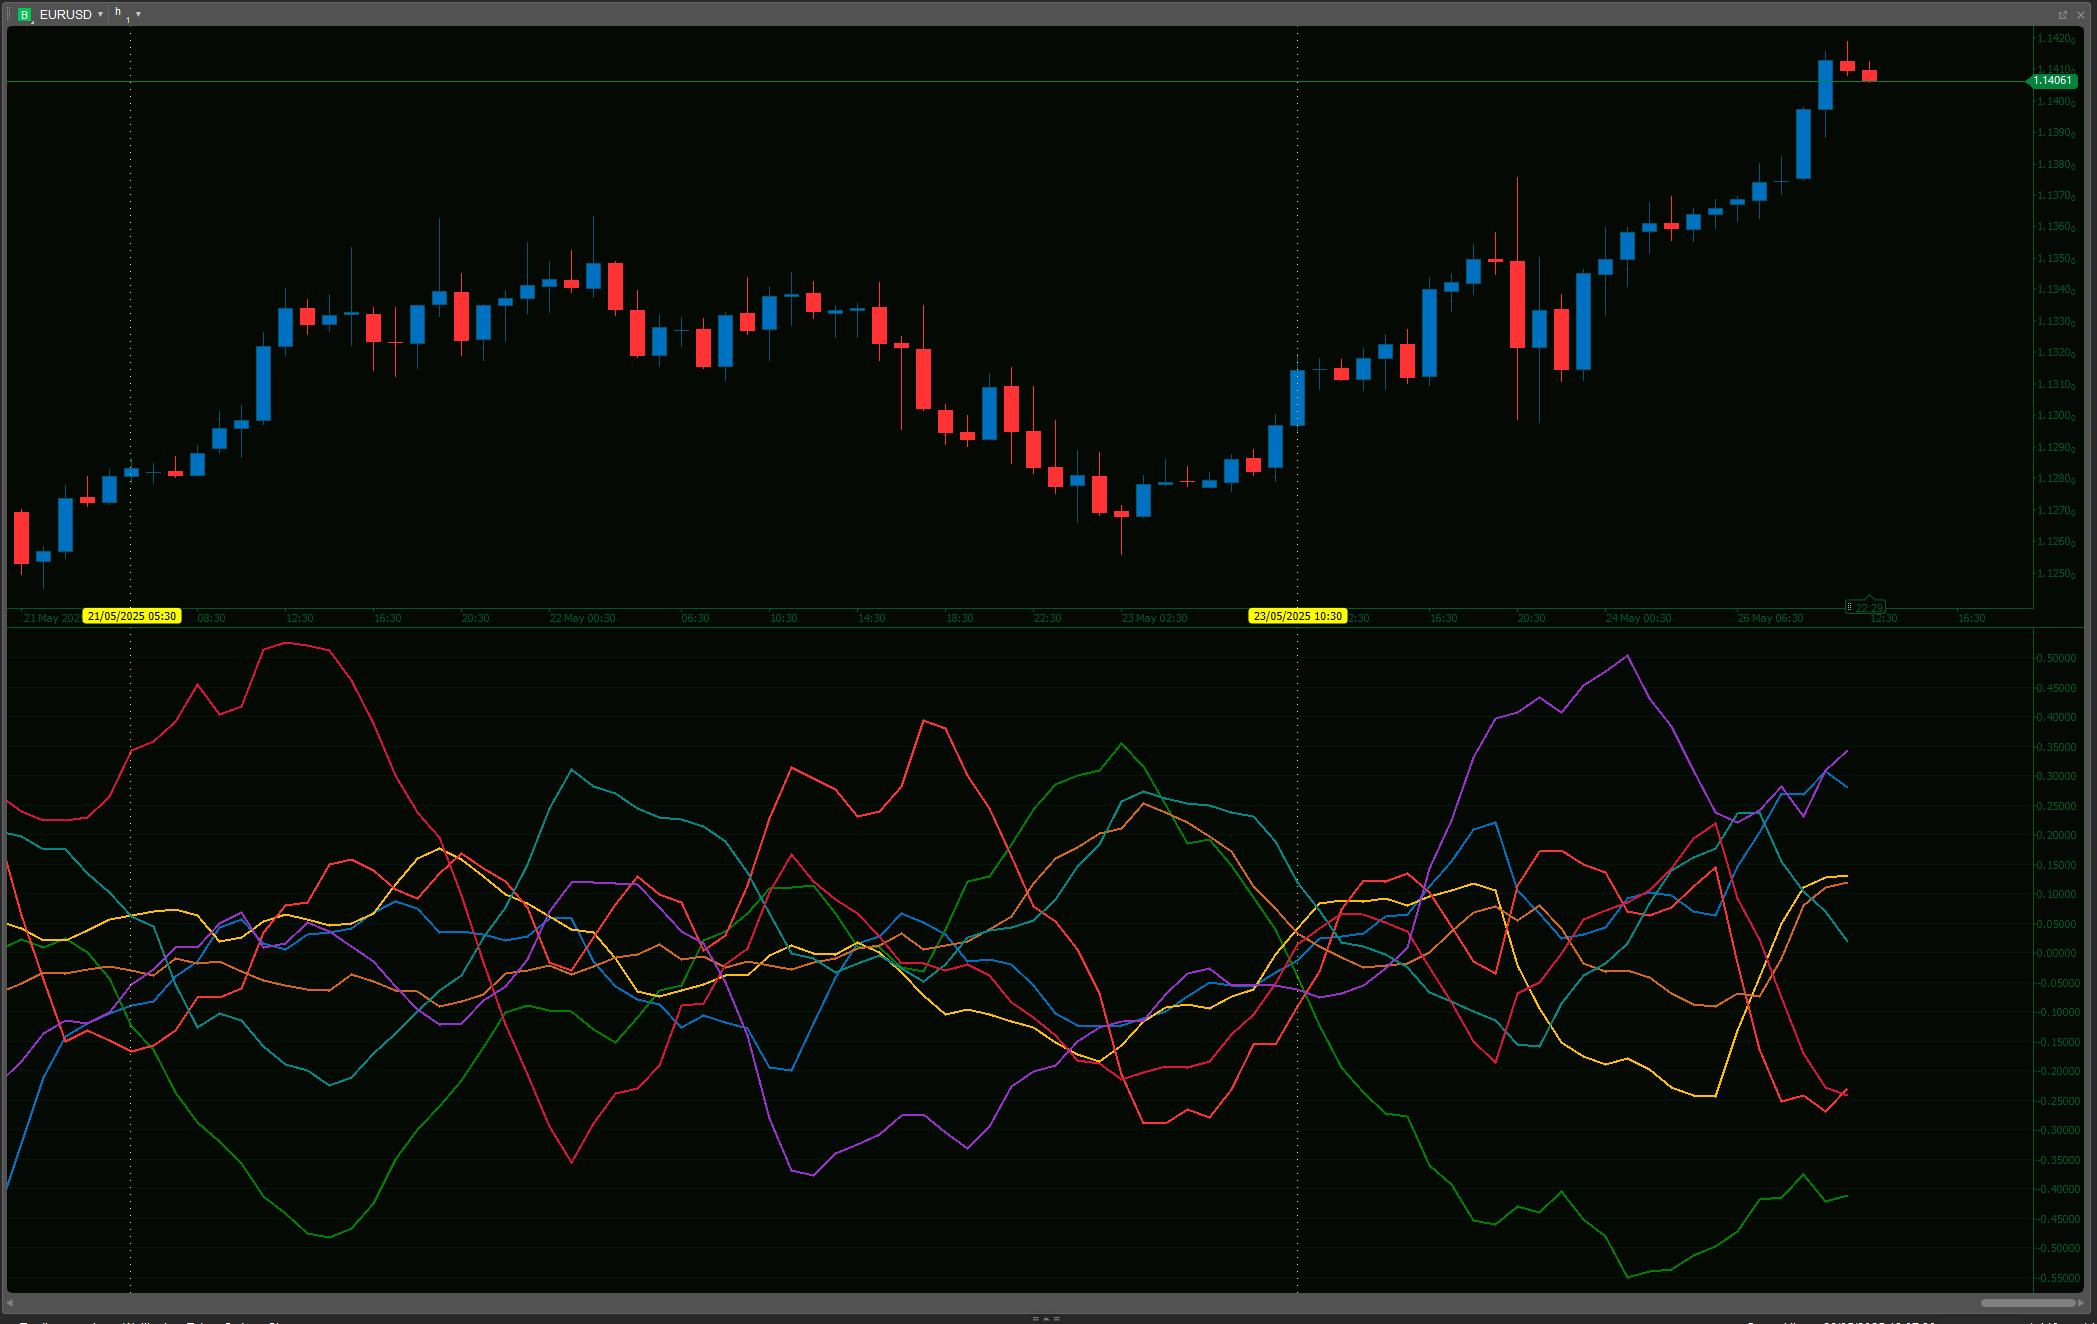
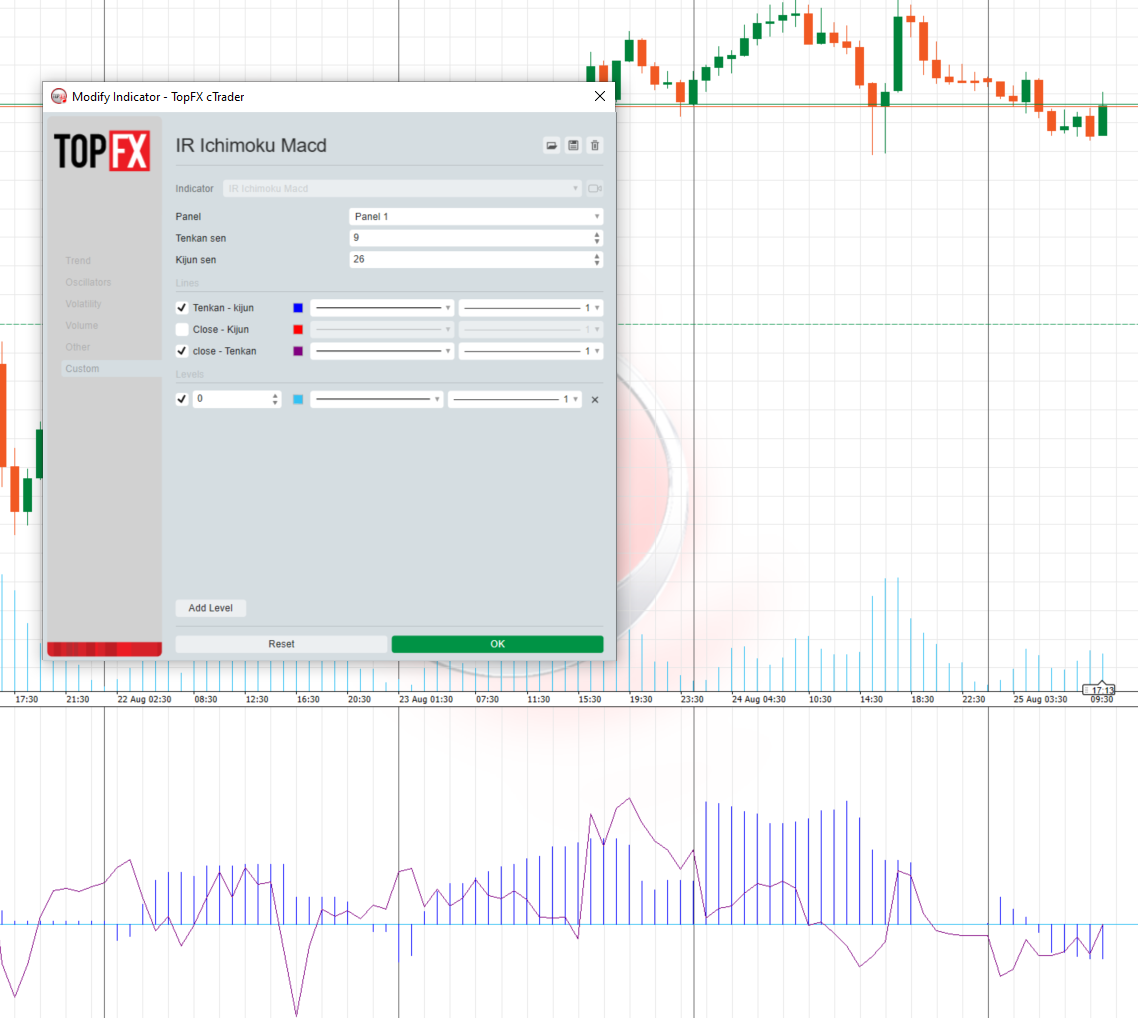
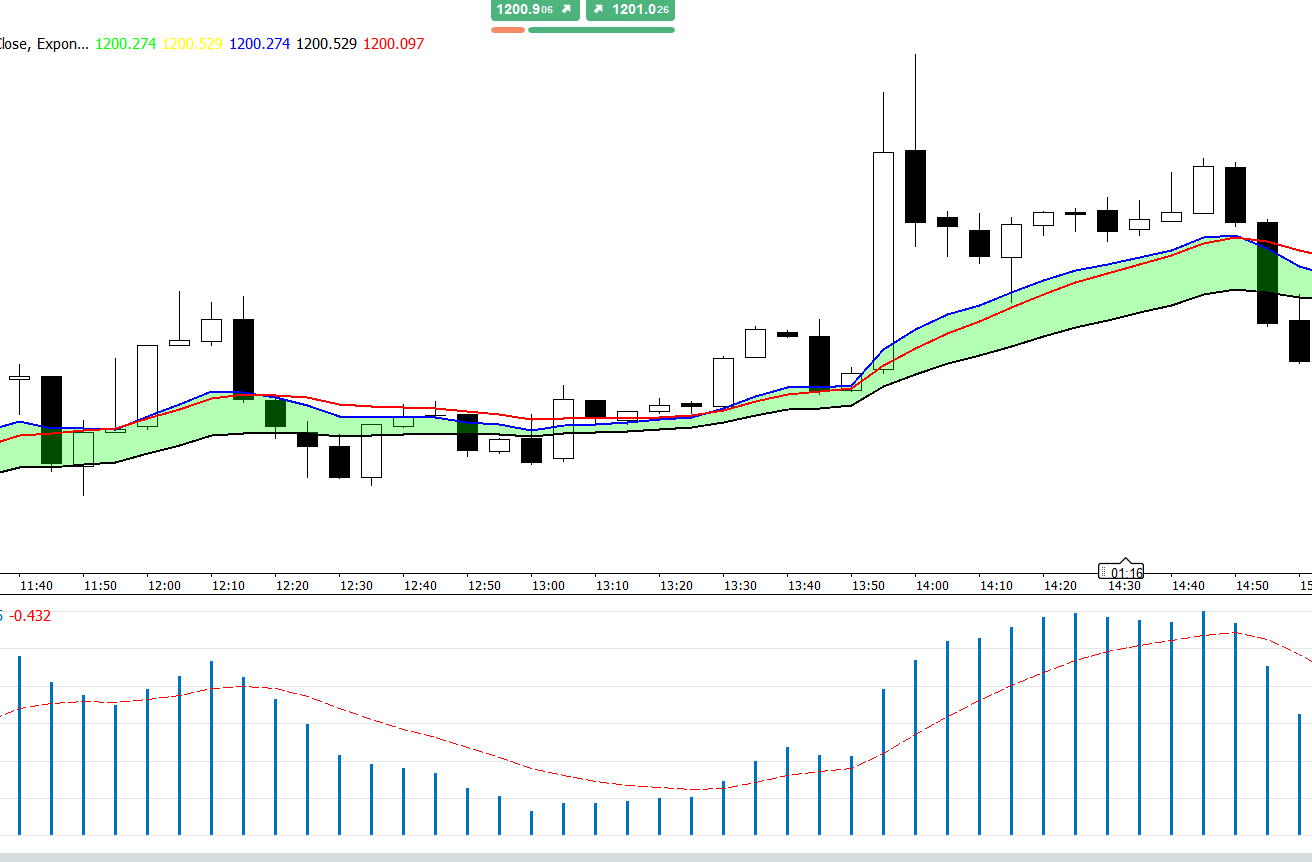
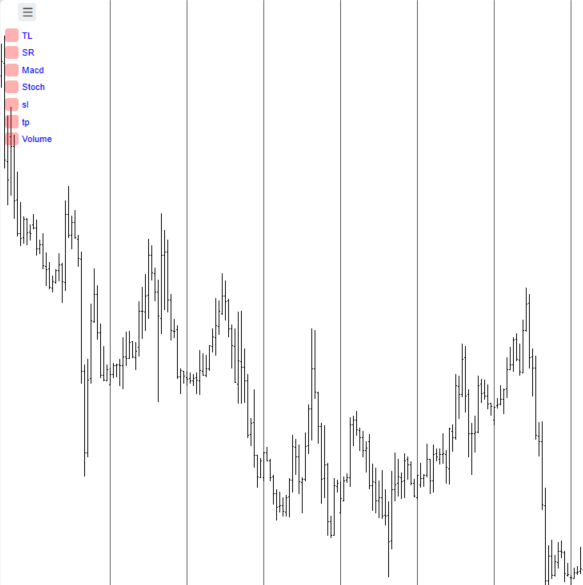
IR Ichimoku Macd
Share
5.0
03/09/2025
143
Desktop
IRCtrader
Since 23/01/2025
Free installs
3219
Description
Customer reviews
this indicaotr show distance between Tenkan to Kijun, Close to Kijun and Close to Tenkan
Expand
More from this author
Top-rated
IR Candle MTF
IRCtrader
4.6
(5)
Free
Indicator
IR Candle MTF
with this indicator you could see other time frame candle in your chart.
Free
IR Spread
IRCtrader
Free
Indicator
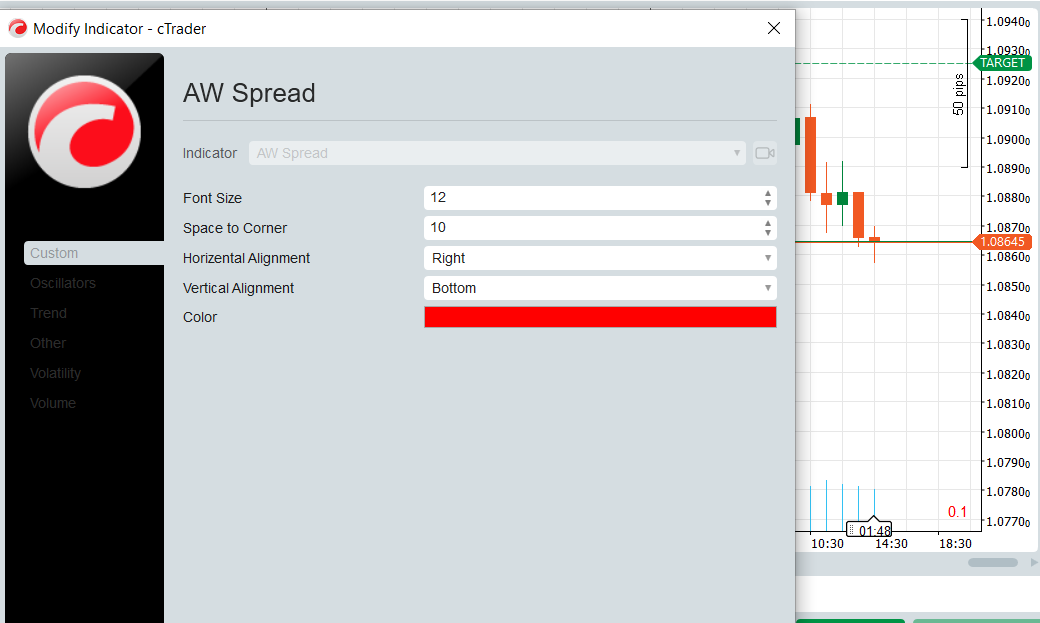
IR Spread
show spread on chart
Free
IR Macd on Chart
IRCtrader
5.0
(1)
Free
Indicator
MACD
IR Macd on Chart
this indicator show macd on chart.
Free
Top-rated
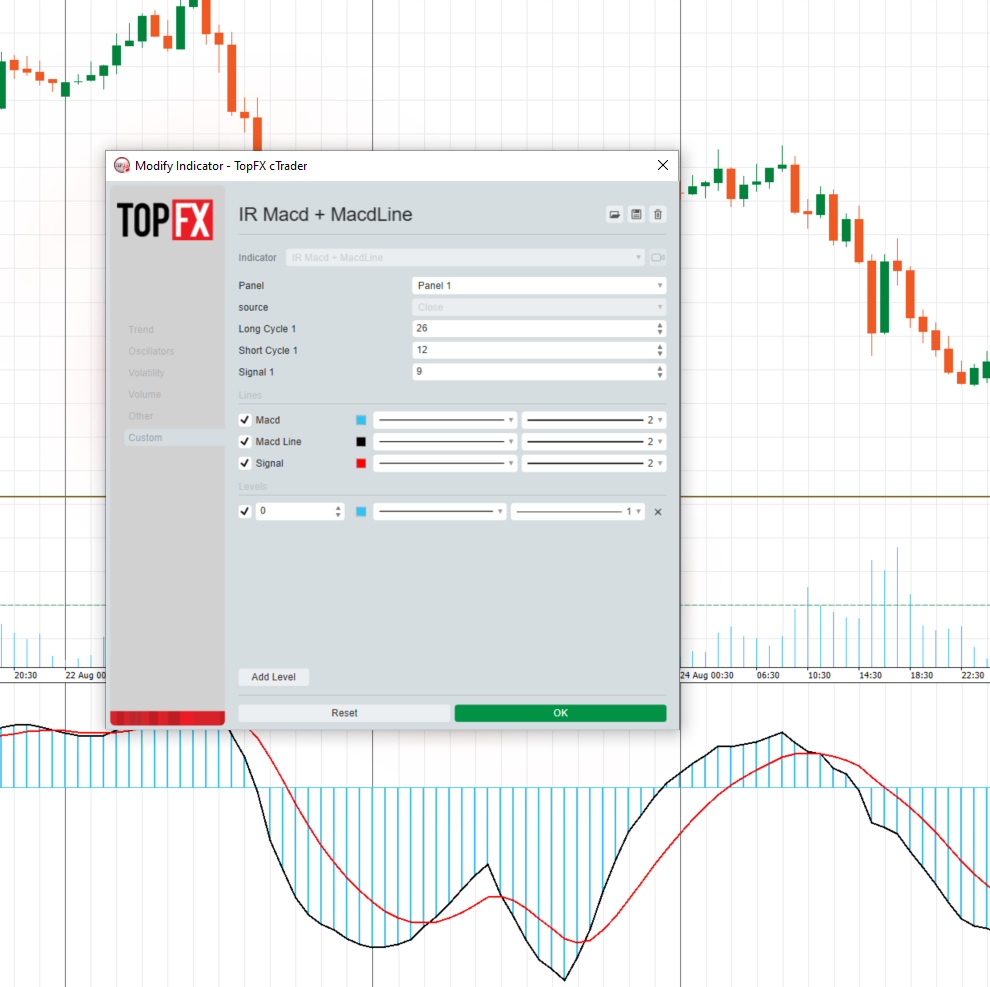
IR Macd + MacdLine
IRCtrader
5.0
(2)
Free
Indicator
MACD
IR Macd + MacdLine
some user add moving average to macd to see better. in ctrader 4.3.11 there is a problem with this . I make a macd tha
Free
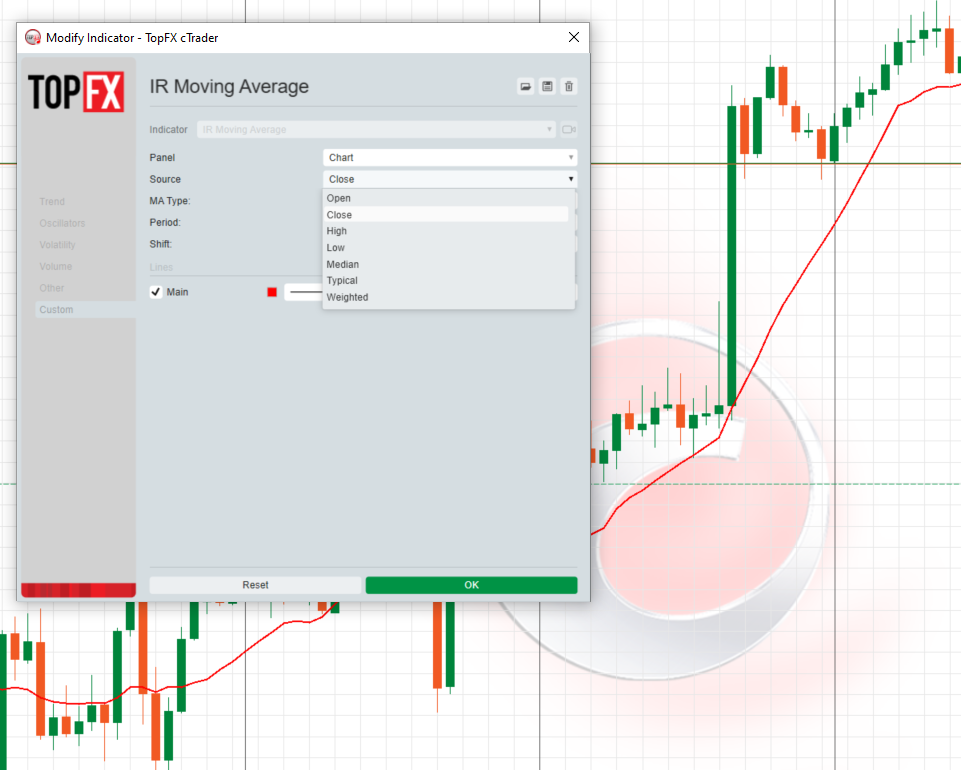
IR Moving Average
IRCtrader
5.0
(1)
Free
Indicator
IR Moving Average
this moving include everything that a trader needs from Moving Average.
Free
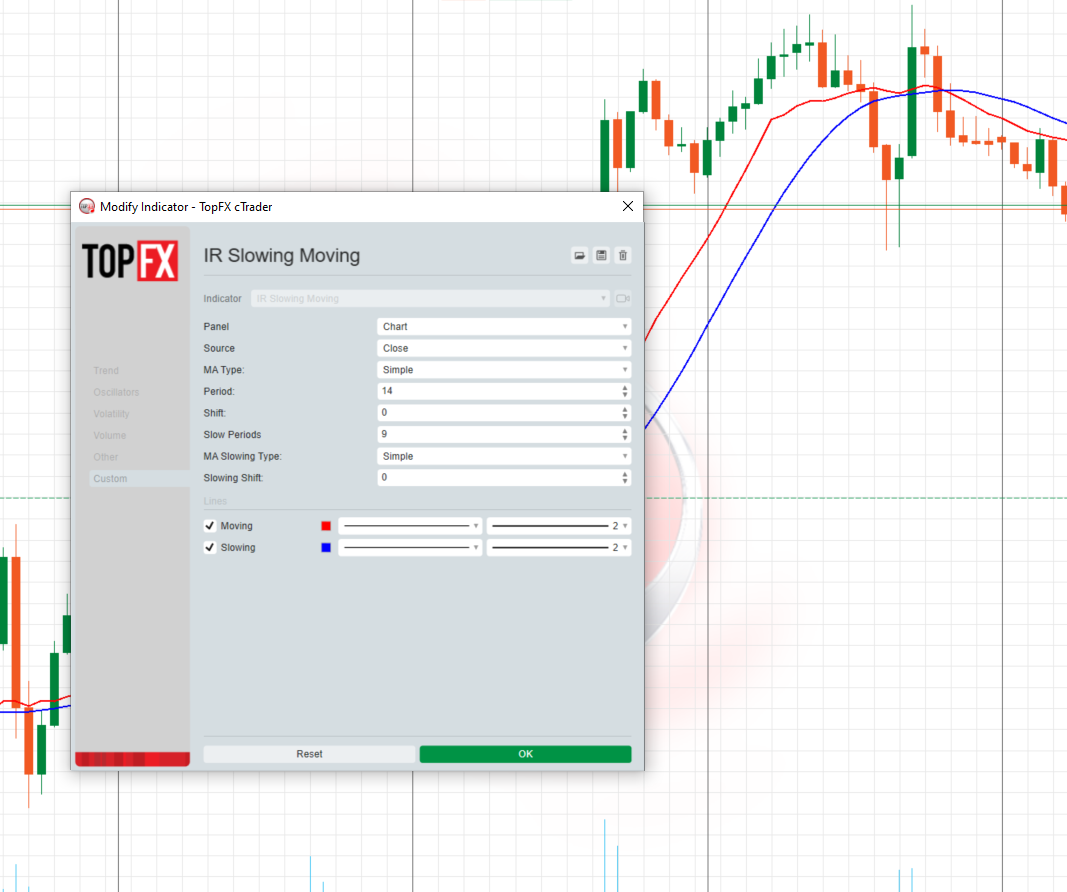
IR Slowing Moving
IRCtrader
5.0
(1)
Free
Indicator
IR Slowing Moving
Add Slowing to IR Moving Average.
Free
IR CheckList
IRCtrader
Free
Indicator
IR CheckList
you could put your check list in your chart you could split your test with “,” you could put your checklist in indicat
Free
IR Moving MTF
IRCtrader
Free
Indicator
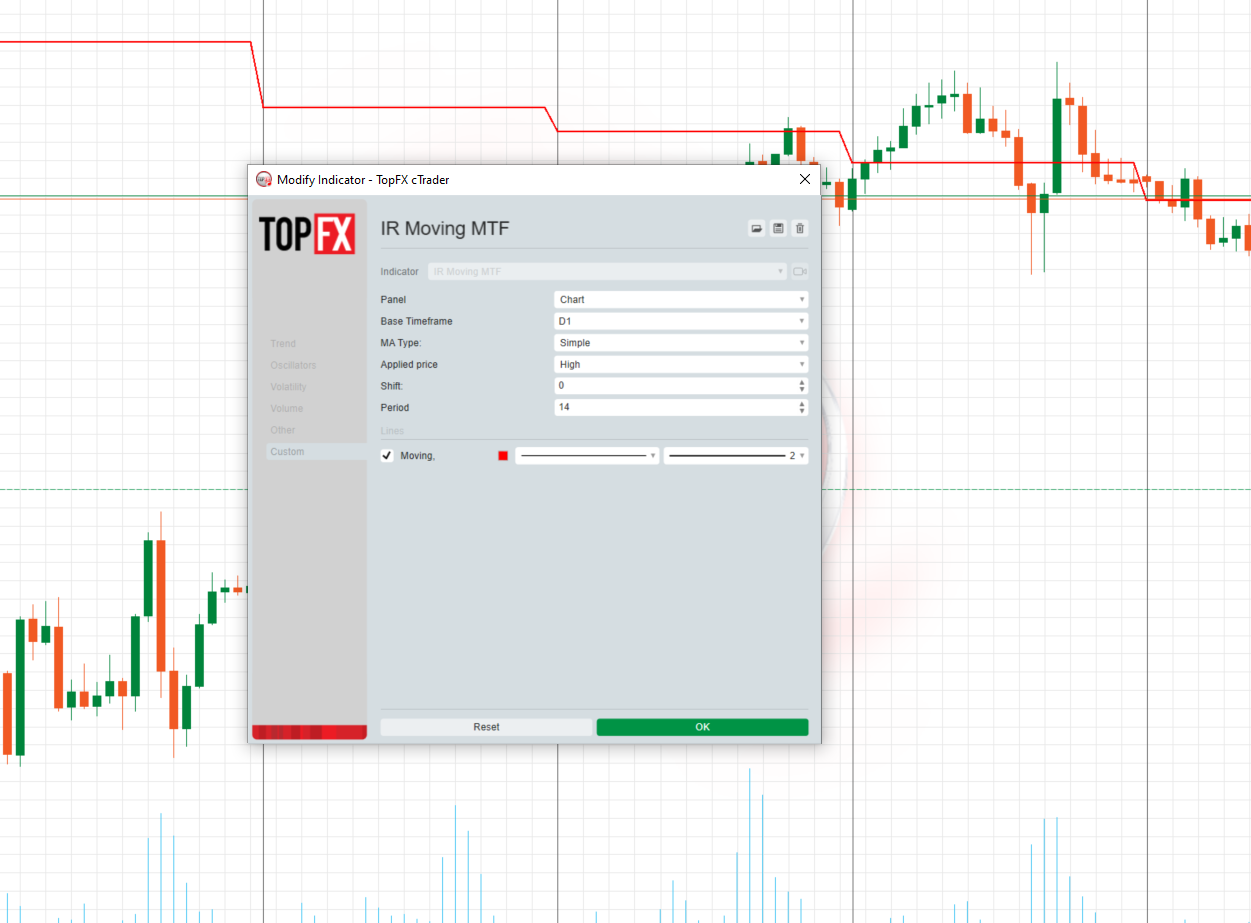
IR Moving MTF
multi time frame moving averge. you could choose different type of price like median ,high and ... and differnt type of
Free
IR Coral
IRCtrader
5.0
(1)
Free
Indicator
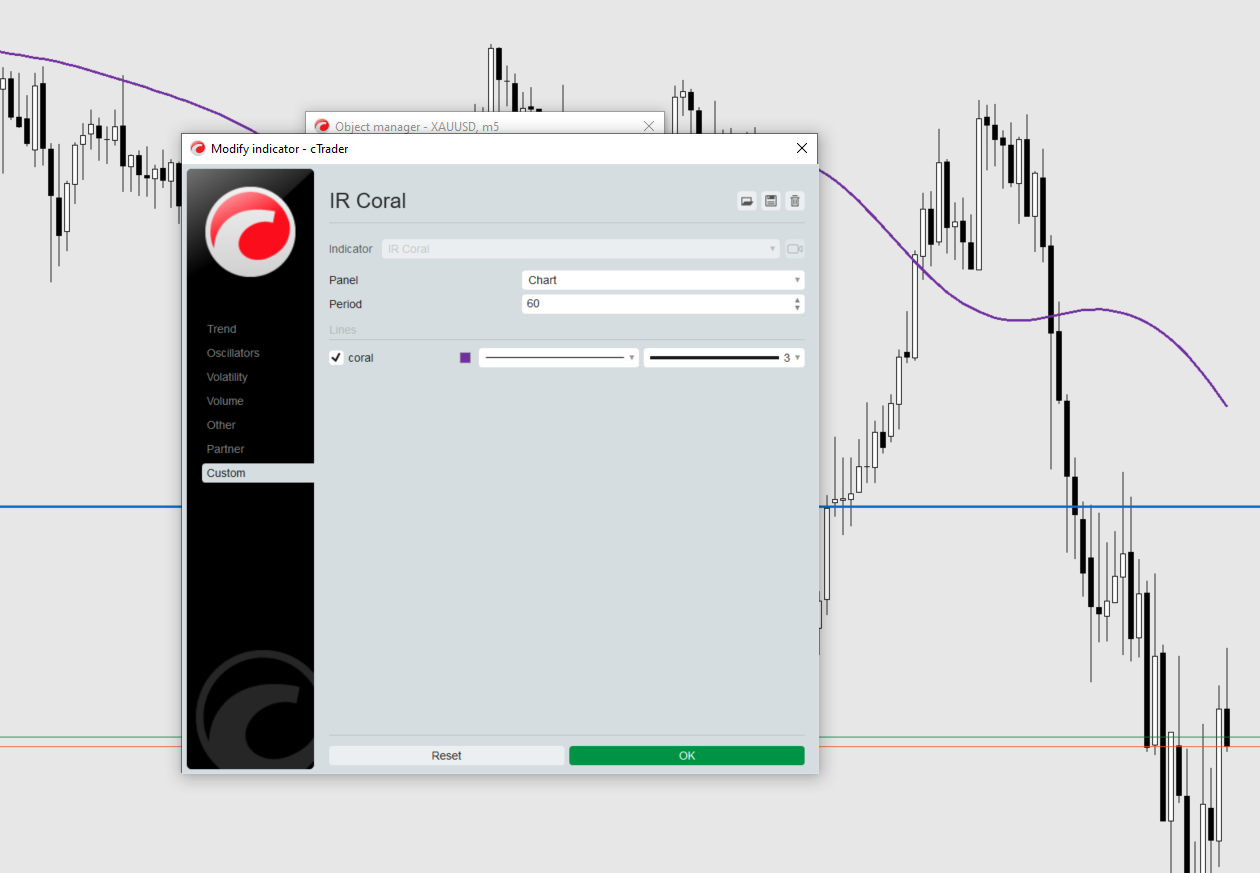
IR Coral
Coral indicator
Free
IR VLine
IRCtrader
5.0
(1)
Free
Indicator
IR VLine
don't move to the end of chart after timeframe changing. it should be better to use for near history. for long history
Free
IR Multi Data
IRCtrader
5.0
(1)
Free
Indicator
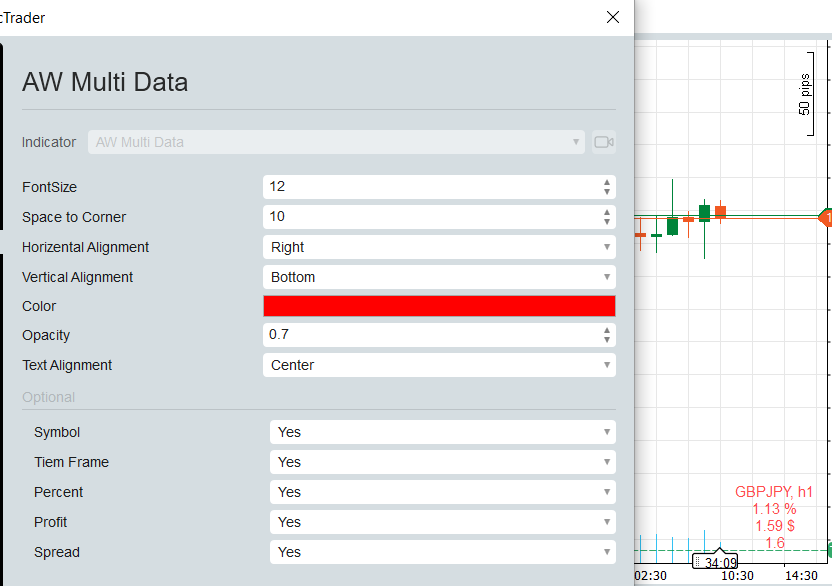
IR Multi Data
show symbol and time fram, daily net profit percent, daily net profit, and spread ln your chart. consider that timezone
Free
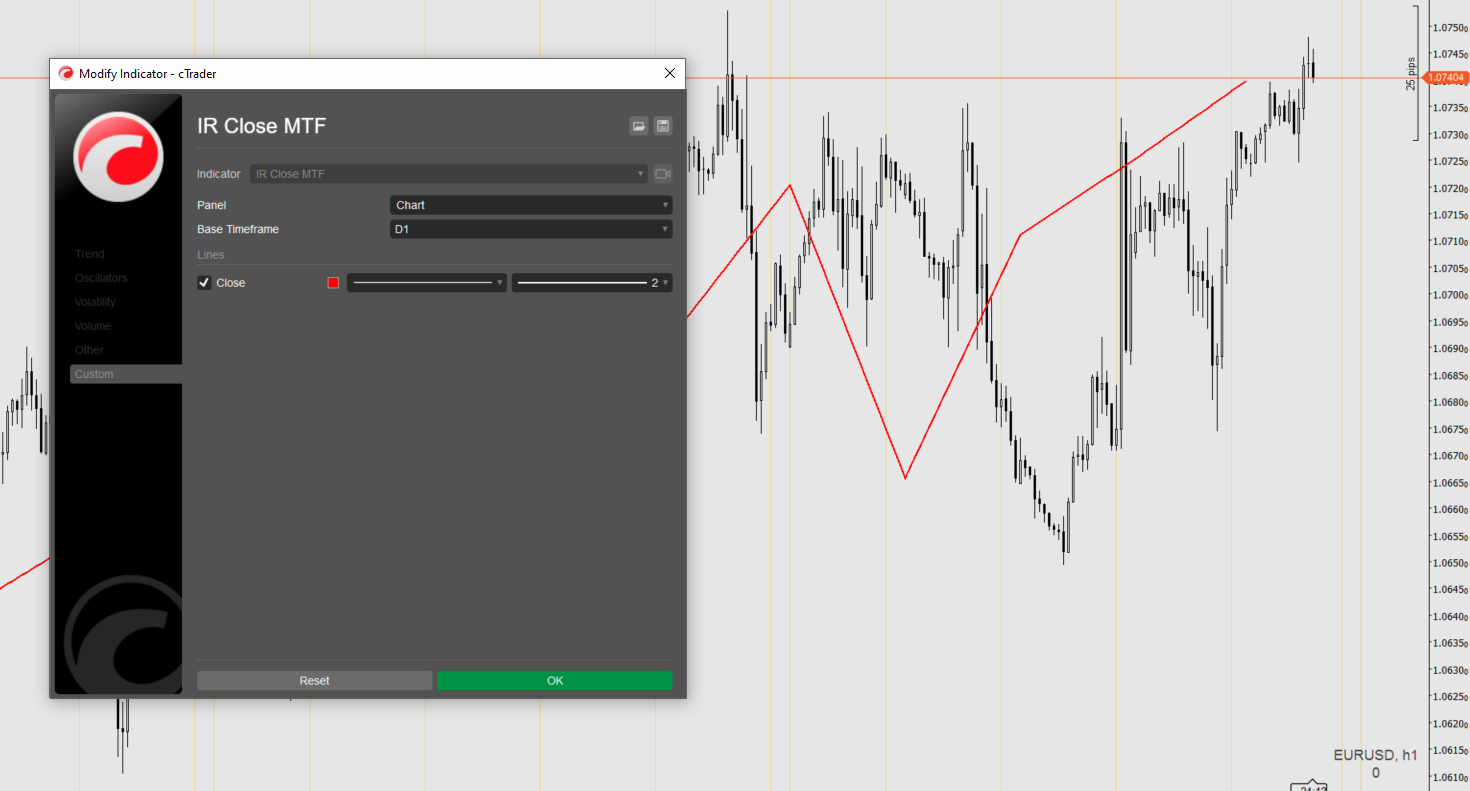
IR Close MTF
IRCtrader
5.0
(1)
Free
Indicator
IR Close MTF
this indicator show other time frame close in lower time frame. for ex: show daily close in m 15.
Free
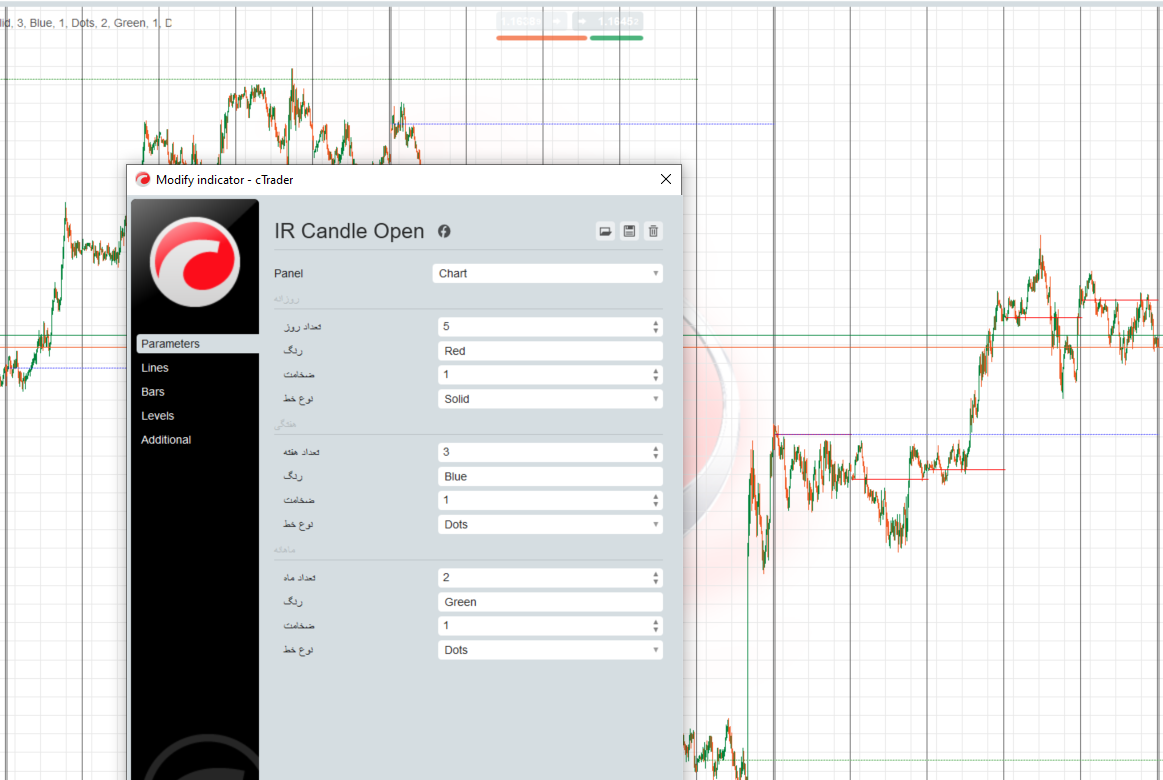
IR Candle Open
IRCtrader
Free
Indicator
IR Candle Open
IR Candle Open plots customizable opening price lines for daily, weekly, and monthly candles
Free
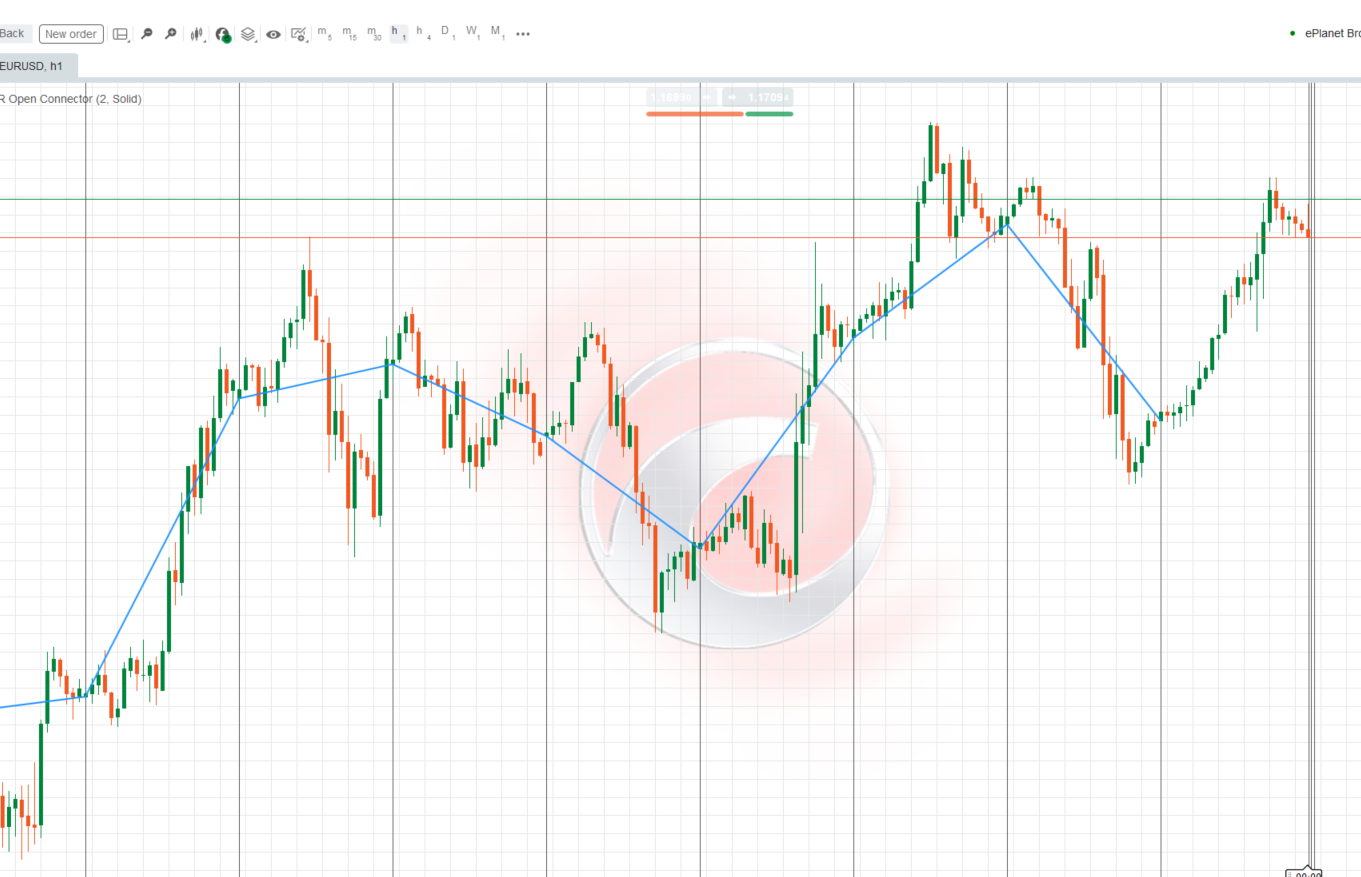
IR Open Connector
IRCtrader
Free
Indicator
IR Open Connector
This indicator connects the opening prices of higher timeframe candles (Daily, Weekly, Monthly, or
Free
You may also like
Top-rated
TPO Profile v2.0
srlcarlg
4.7
(4)
Free
Indicator
VWAP
Indices
Forex
TPO Profile v2.0
TPO Profile v2.0
Free
Popular
Supertrend Indicator v1.1
Pine2cTrader
$ 10
Indicator
Supertrend Indicator v1.1
SUPERTREND INDICATOR v1.1
$ 10
New
Market Bias Gauge
MURTADHA1445
4.0
(1)
Free
Indicator
Indices
XAUUSD
Breakout
+9
Market Bias Gauge
Measure Market Strength at a Glance – Instantly
Free
Zones Supply Demand
pinescriptlabs
3.5
(2)
Free
Indicator
RSI
Breakout
XAUUSD
+5
Zones Supply Demand
📊Zones Supply & Demand: Identifies key price levels with high volume concentration, marking Supply/Demand Zones & Marke
Free
Popular
DOMFlowScalperPRO
traderKingDev
$ 10
Indicator
DOMFlowScalperPRO
Scalp smarter with DOM Flow Scalper PRO – real-time Bid/Ask imbalance and volume precision!
$ 10
Popular
BSL_SSL_Liqudity
Dineshkumar_FX
$ 30
/
$50
Indicator
NAS100
Indices
XAUUSD
+4
BSL_SSL_Liqudity
Buy-Side & Sell-Side Liquidity (BSL/SSL) Indicator
$ 30
/
$50
8 Currencies_NSC
lifeofmichaeltrading
$ 10
Indicator
NZDUSD
Forex
USDJPY
+1
8 Currencies_NSC
RCS: 8 majors! AUD,USD,EUR,JPY,GBP,CAD,CHF,NZD. Find how strong each currency is relatively and trade smarter!
$ 10
Multi-Asset Performance Matrix
pinescriptlabs
5.0
(1)
Free
Indicator
RSI
Breakout
XAUUSD
+6
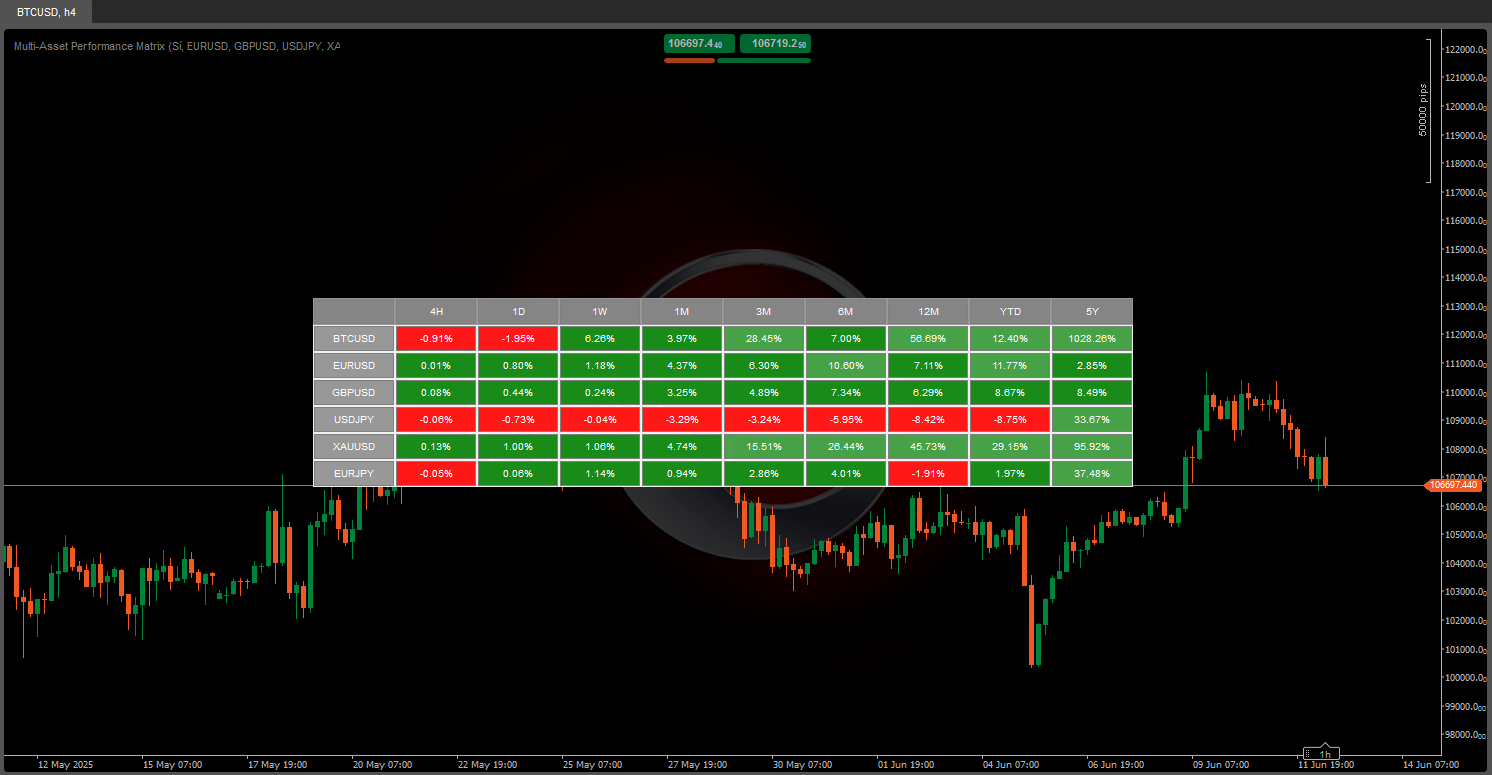
Multi-Asset Performance Matrix
Visual tool tracking financial assets' % performance across timeframes, highlighting trends with color-coded insights.
Free
New
Info Dashboard_noSourceCode
storefx47
$ 17
/
$20
Indicator
NAS100
NZDUSD
Martingale
+26
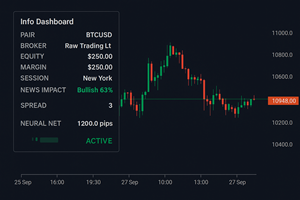
Info Dashboard_noSourceCode
Read the market with AI: live sentiment, news impact, equity, spread & neural net signals in one dashboard.
$ 17
/
$20
DMI 3 bar v2
PrezMastersZA
$ 25
/
$50
Indicator
DMI 3 bar v2
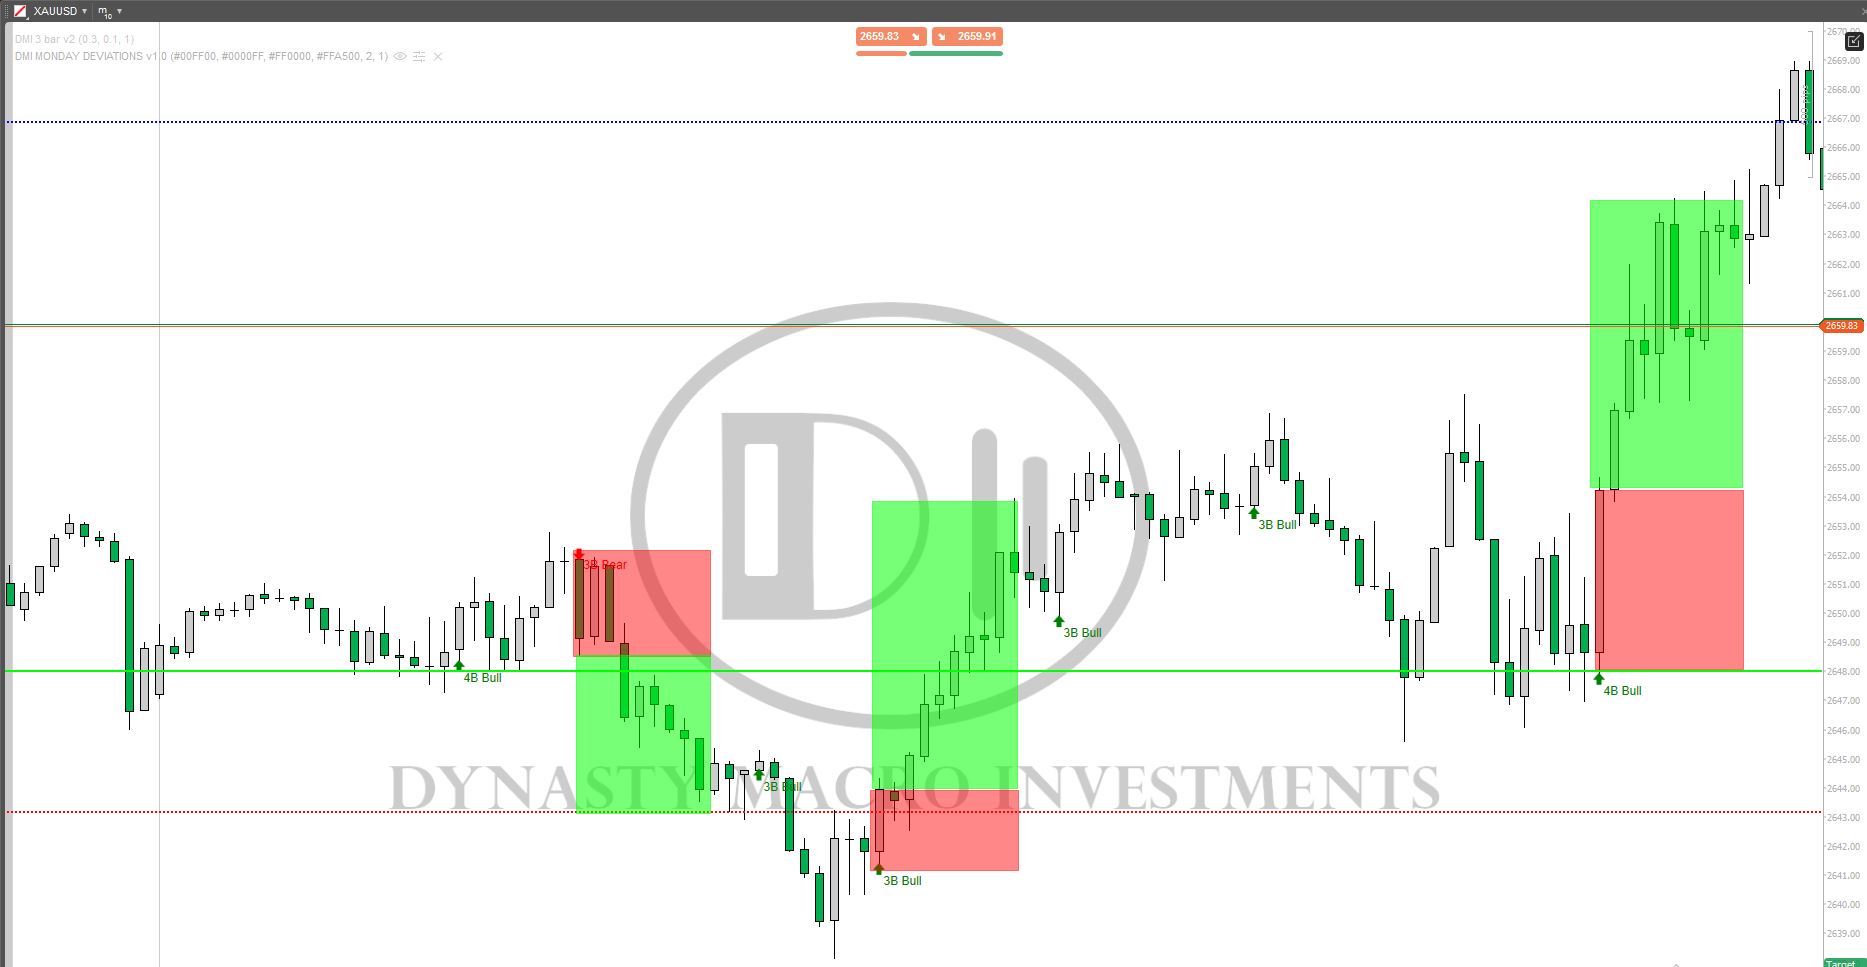
Shows BUY & SELL signals for 3 & 4 BAR PATTERN (Morning star/ Evening star). It is adjustable and it will SHOW ARROWS.
$ 25
/
$50
Top-rated
Free Volume Profile v2.0
srlcarlg
4.6
(5)
Free
Indicator
VWAP
Free Volume Profile v2.0
Free Volume Profile v2.0
Free
Premium Discount Zones
pinescriptlabs
Free
Indicator
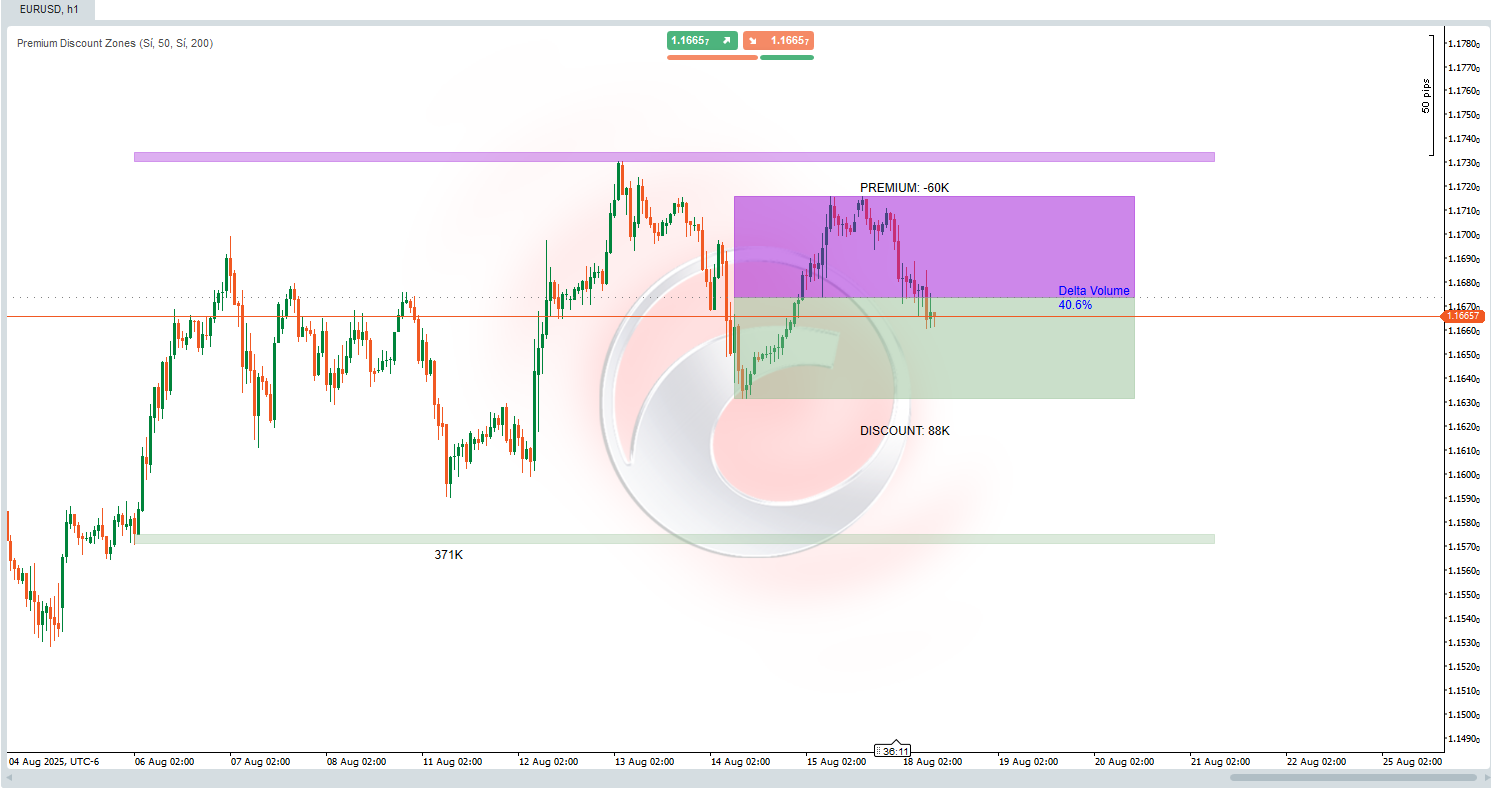
Premium Discount Zones
Premium Discount Zones" spots key areas (🟣Premium/🟢Discount) using recent highs/lows & volume..............
Free
Top-rated
E7 Polynomial Regression Channel
Gwave
4.6
(3)
Free
Indicator
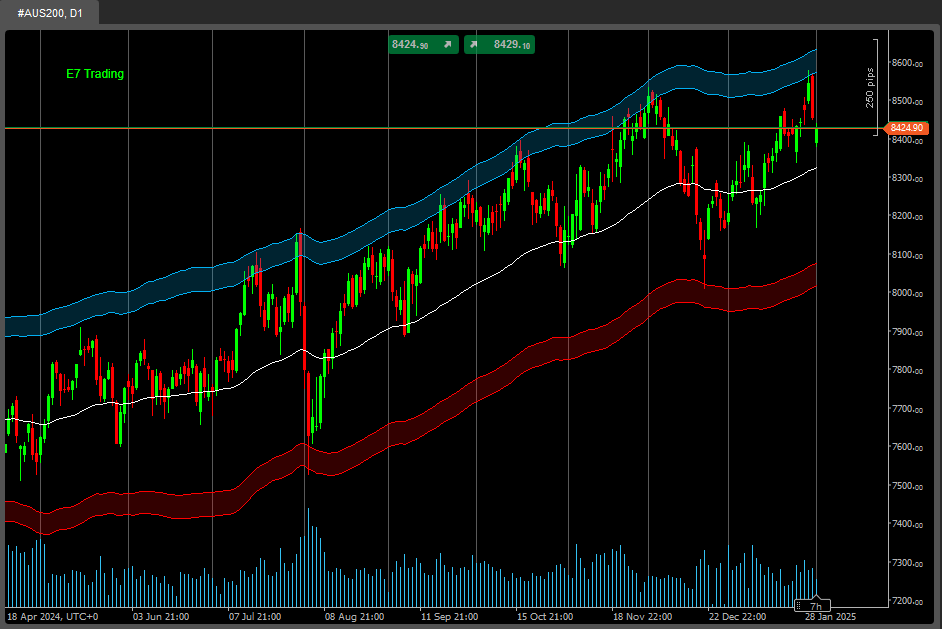
E7 Polynomial Regression Channel
Polynomial Regression Channel which also reflects the volatility of the underlying asset.
Free
New
Trend Scope pro
MURTADHA1445
$ 15
/
$19
Indicator
Grid
XAUUSD
ATR
+5
Trend Scope pro
Trend Scope Pro – Smarter Trend Analysis with Linear Regression Channels
$ 15
/
$19
Vsamarth Indi
vsamarth28
Free
Indicator
Vsamarth Indi
One‑click RSI robot for consistent rapid‑fire trades.
Free
Popular
VegaXLR - cTrader Multi-Timeframe Pivot Pro
vegaxlr
5.0
(1)
$ 25
Indicator
Forex
VegaXLR - cTrader Multi-Timeframe Pivot Pro
Customizable multi-timeframe pivot point indicator for cTrader with alerts, Fibonacci, CPR, and more!
$ 25
Blocks Liquidity MGC
Goulart
5.0
(1)
Free
Indicator
Blocks Liquidity MGC
BlocksLiquidity Indicator Analysis!
Free
RSI Divergence Pro
dasen92
$ 10
Indicator
RSI Divergence Pro
This an RSI Divergence indicator which fulfill seller's need.
$ 10
Load more


.png)

.png)