E7 Correlation Dashboard
"E7 Correlation Dashboard" logo
5.0
03/09/2025
315
Desktop
Since 18/12/2024
Free installs
2344
"E7 Correlation Dashboard" uploaded image

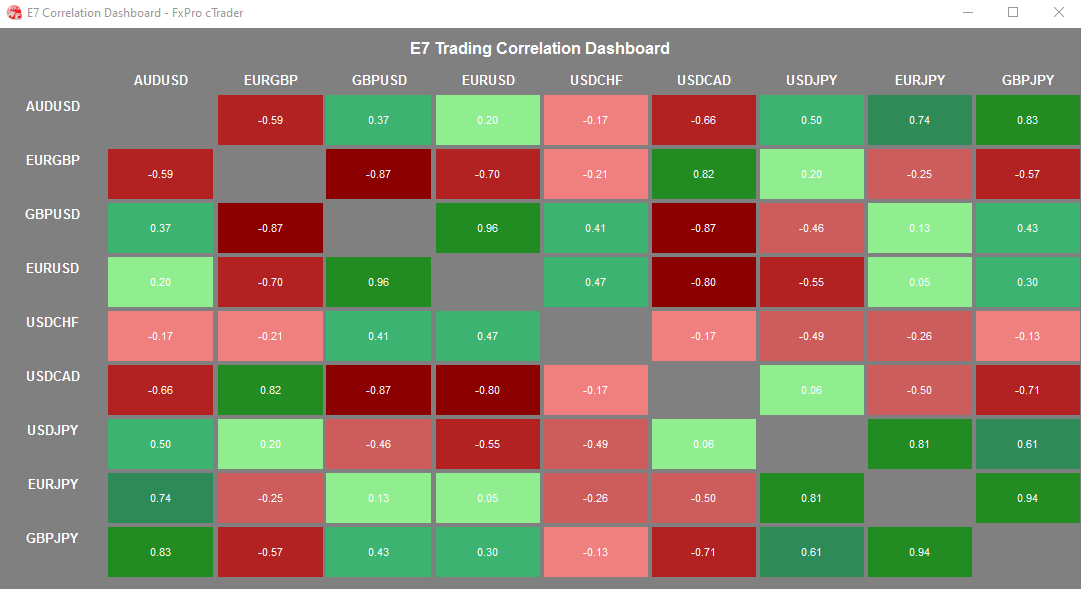
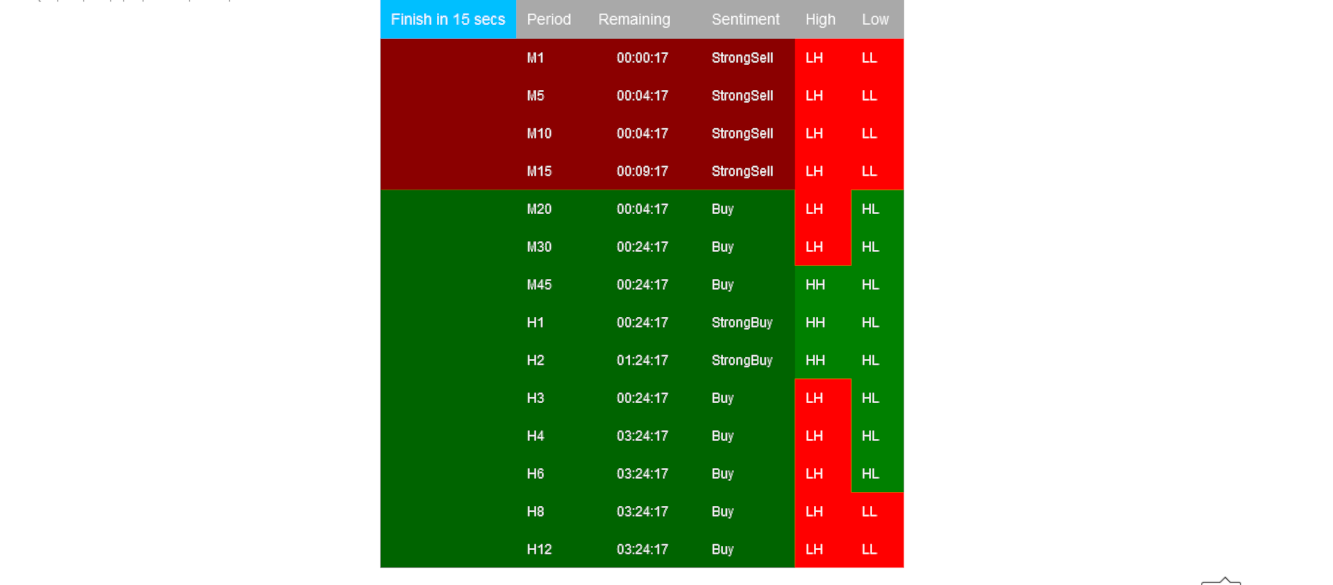
Just a simple Correlation Dashboard.

Future versions will include more functionalities.

Happy hunting!

More from this author
E7 Polynomial Regression Channel
Polynomial Regression Channel which also reflects the volatility of the underlying asset.
E7 BBKG Indicator
E7 BBKG indicator with 80% plus accuracy used to show both, possible reversal and trend.
E7 Volume Profile
E7 Volume Profile, more modern look and feel.
E7 Harmonic Structures Basic
E7 Harmonic Structures Basic.
Indicator
Indices
E7 BlackScholes Model
Option pricing using the BlackScholes model and the Math.Numerics packages
Indicator
Bollinger
E7 Indicators Free Overlays
Bollinger Band Cloud, Heiken Ashi, Trend Follower and Parabolic SAR.
Indicator
Bollinger
E7 Indicators Free Studies
ADXR, KDJ, SineWave, Bollinger Band Volatility and AEOscillator.
E7 BBKG NumSharp Sample
NumSharp and Pandas Sample CODE ONLY!!! Our mission is to make Machine Learning inside cTrader easier for everyone.
E7 cTrader User ID
cTrader ID
You may also like
Indicator
NAS100
NZDUSD
XAUUSD
+11
Samurai Breakout Lite
⚔️Limited version. Draws clean session box (Tokyo / London / New York / Overlap) and optional breakout plan (EP/TP/SL)⚔️
Indicator
Signal
Hammer Pattern Indicator
E7 Harmonic Structures Basic
E7 Harmonic Structures Basic.
Indicator
Breakout
ATR
LT_SmartSwings
Detects swing highs/lows, structure, breakouts, trend lines, and fibs — great for price action trading.
ICT Killzone and Sessions high_low
This indicator is an essential tool for traders seeking to visualize key trading sessions on their charts.
Hull Moving Average Colored
The traditional Hull Moving Average with different colours based on the slope (direction) of the trend.
Indicator
RSI
XAUUSD
Breakout
+5
Prime Trend Targets
PrimeTrend: ATR trendline detects reversals, plots entry/SL/3 targets. Tune params (speed vs. robustness). Backtest +
Time To Break Even Lite Version
This is the trial version of Time To Break Even, which help you time your trade entry.
Order Flow Ticks v2.0
Indicator
Indices
Stocks
Forex
+1
Bullet Chart
✅ Unique Design. ✅ Works on All Time frames
Indicator
ZigZag
RSI
FVG
+4
Ten Thousand Functions Bands Cloud(First Edition)
A metric that can set 1 to 3 groups of Bollinger Bands
Supply Demand V1-Premium
Auto-detect supply & demand zones, remove broken levels, and trade smarter with real-time alerts. Precision made simple.
Top-rated
Free
BarSentiments
This Indicator is a technical analysis tool that measures the strength and direction of market sentiment
TrendStrengthSignals
Edge-aware clouds + Pro HUD: better entries, calmer exits, adaptive risk.
Flex VWAP
Flexible VWAP indicator with timezone-aware, custom time periods and automatic DST handling.
Trend Direction Force Index - TDFI (Alerts)
Spot Strong Trends Early & Filter Market Noise
HTFBB
Plot higher-timeframe Bollinger Bands for clearer structure, pullback zones, and breakout signals—without switching char
Indicator
Grid
RSI
Breakout
+18
Logarithmic Framework by LudwigICT