Indicator
Breakout
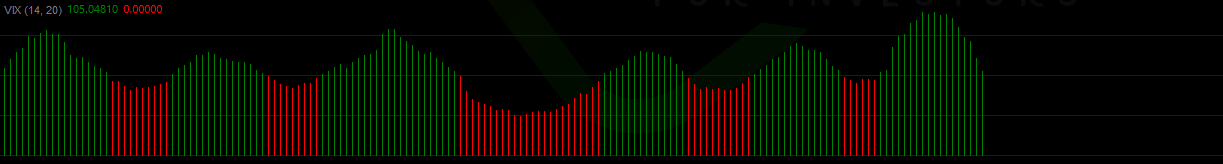
VIX - volatility indicator
01/09/2025
1
Desktop
Since 05/02/2025
Sales
11

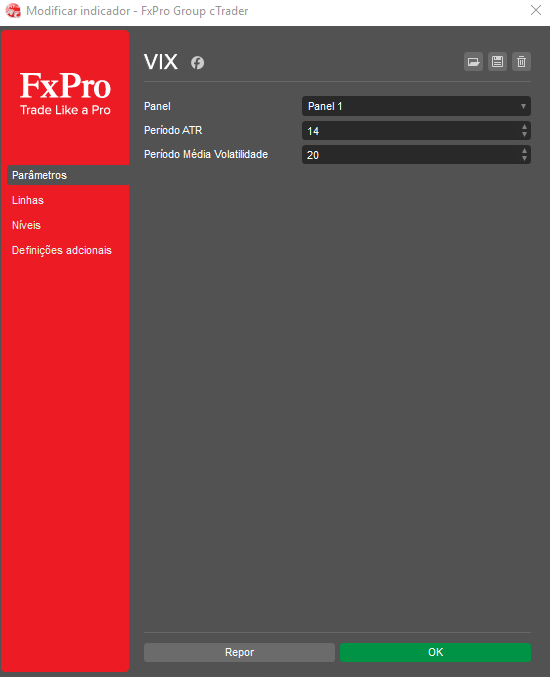
Customize Your Setup for Maximum Insight:
Easily fine-tune the indicator to match your trading strategy by setting the desired values for LowLevel and HighLevel, and adjust the VIX Scale Factor to control the height of the VIX line on the chart.
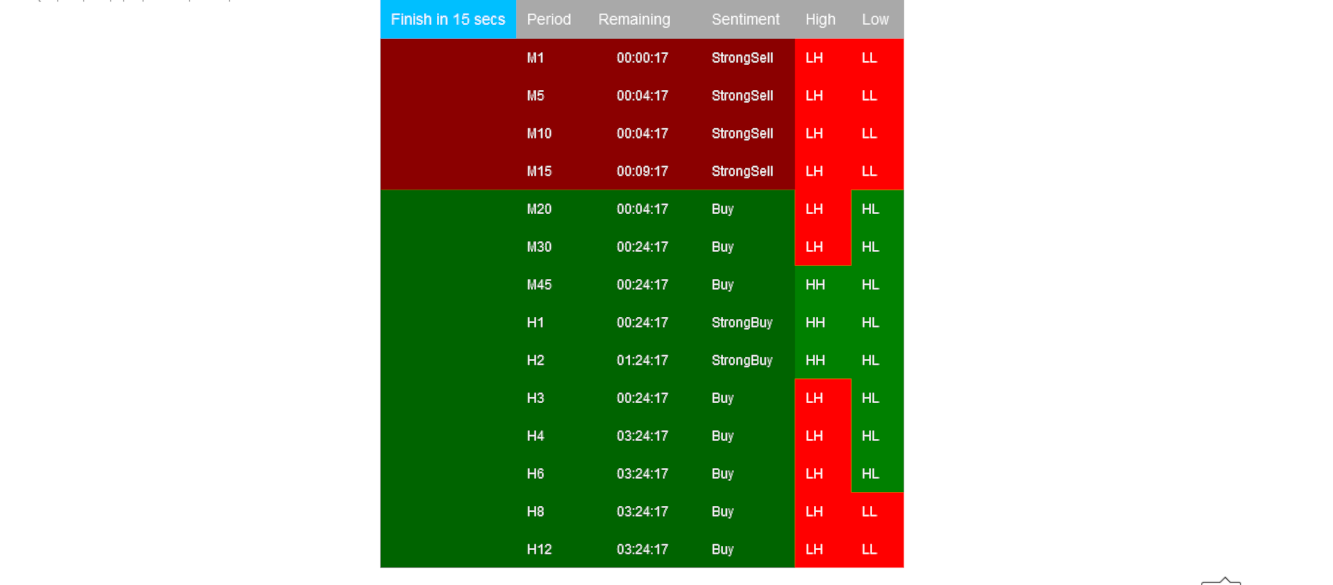
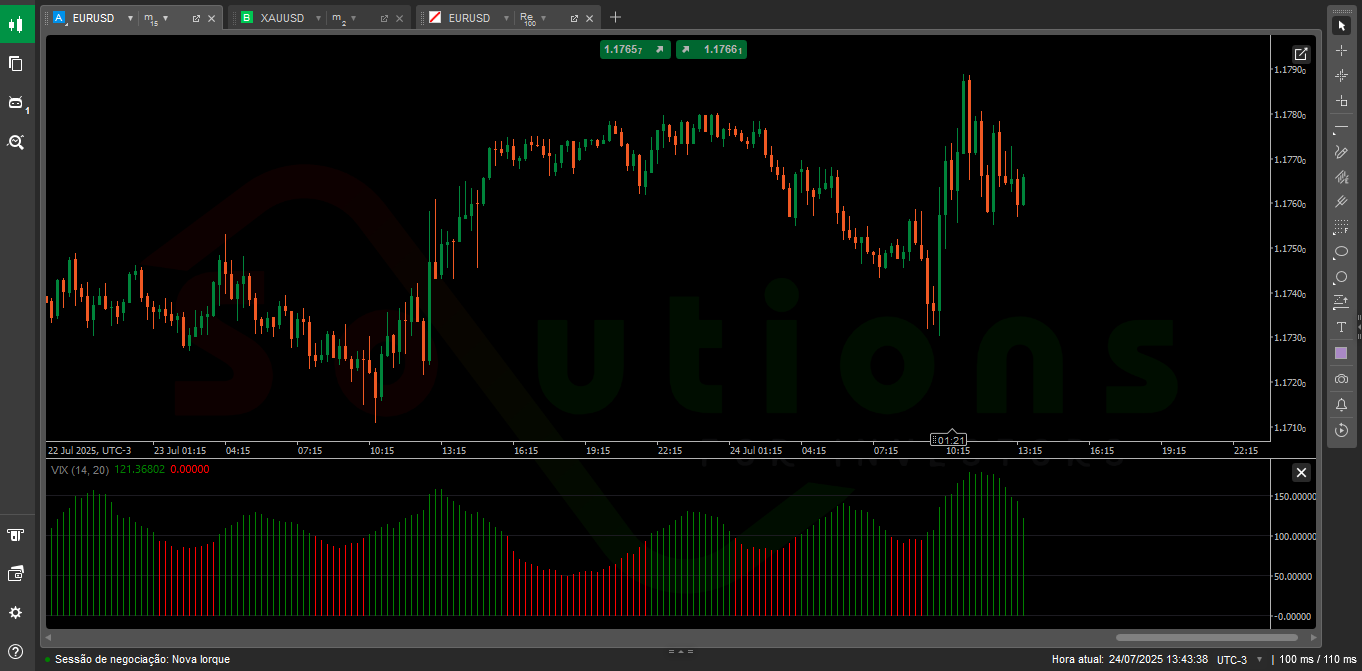
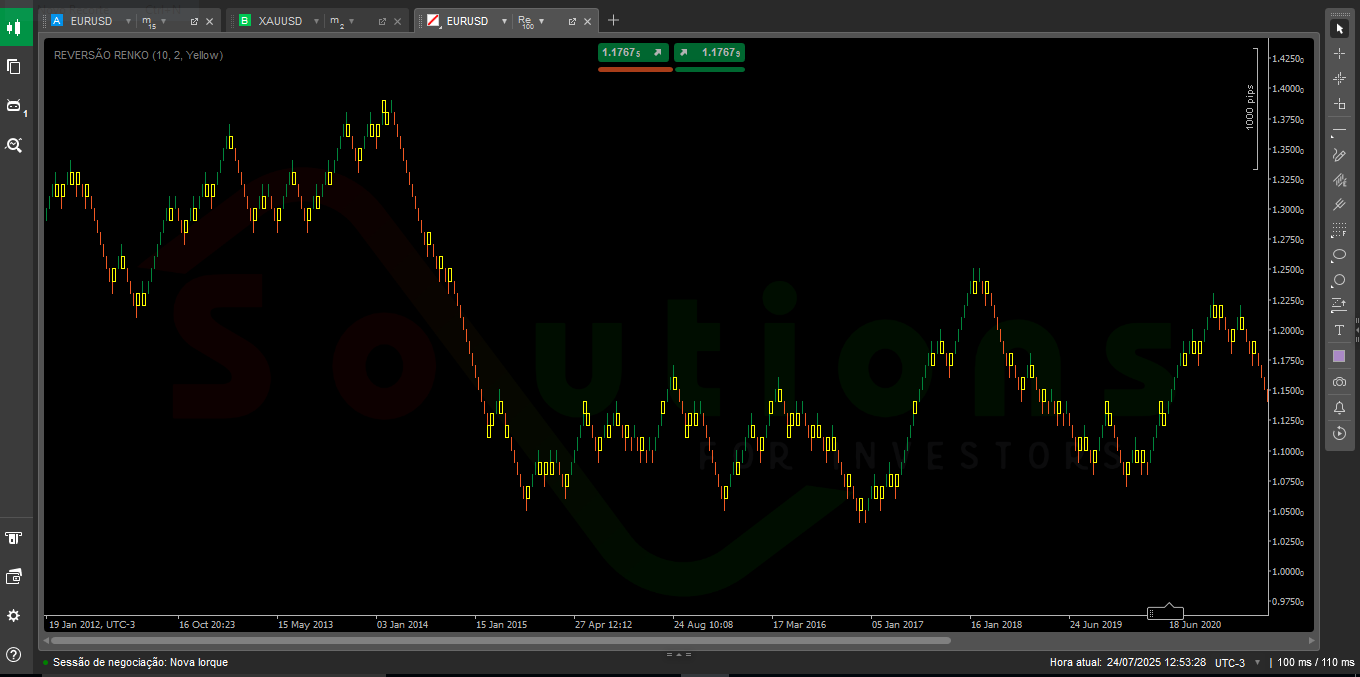
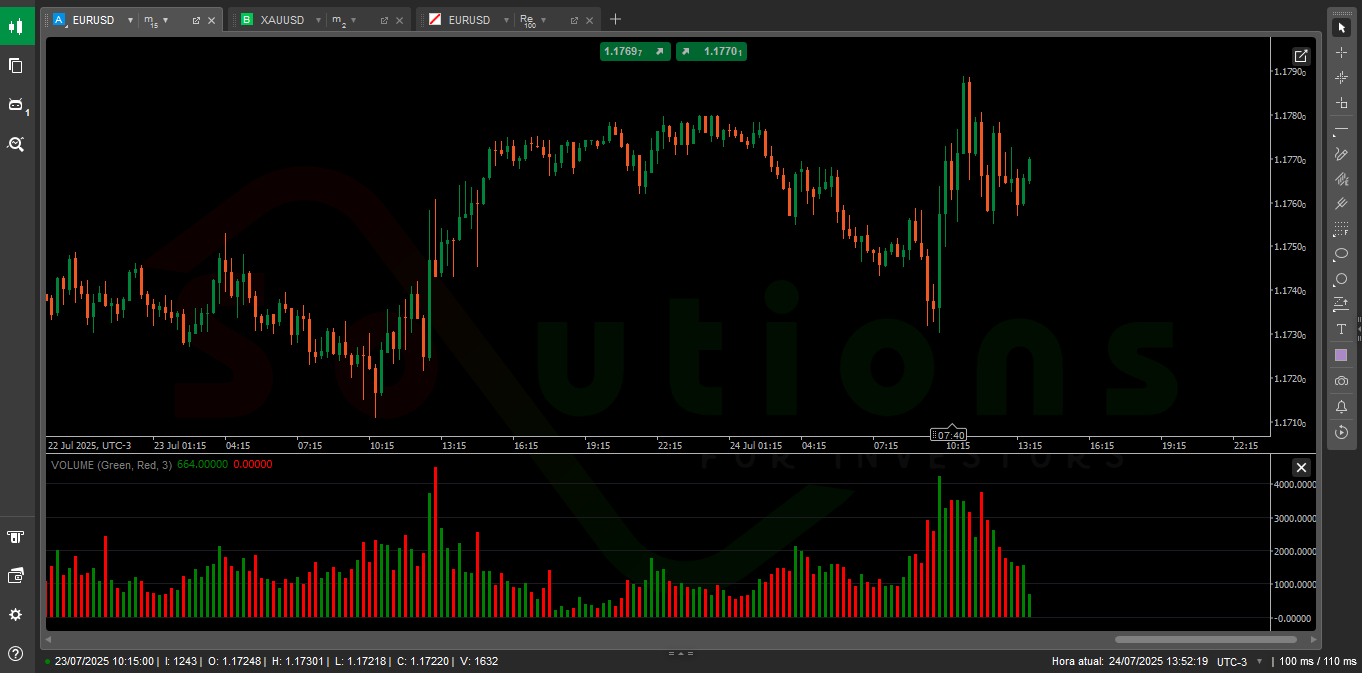
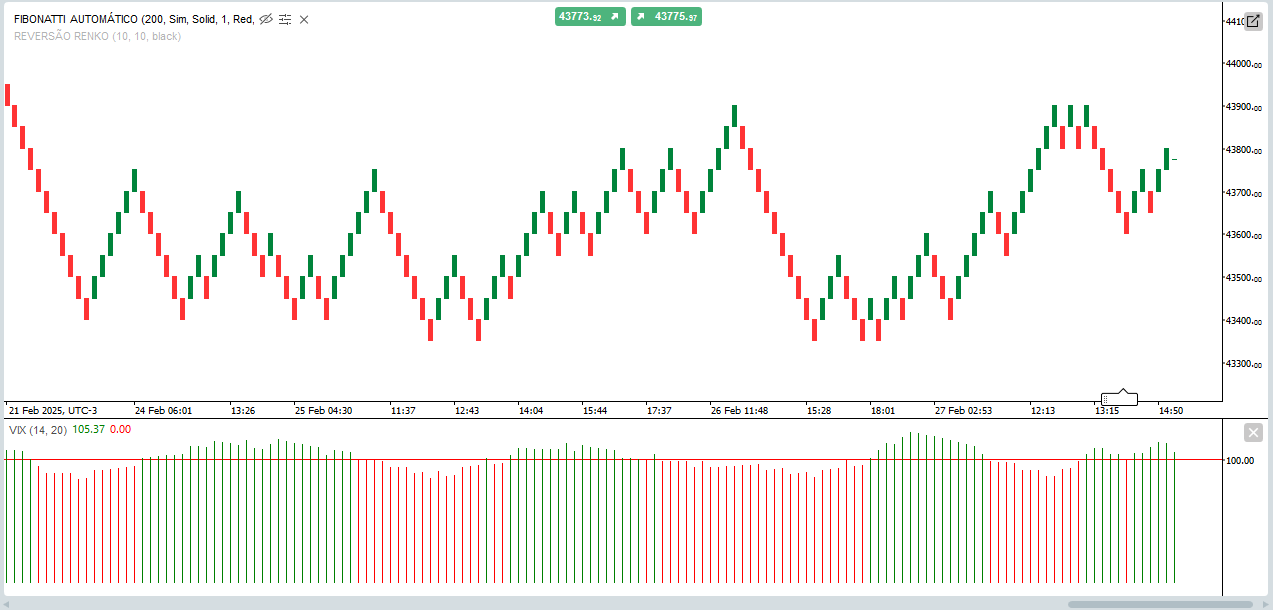
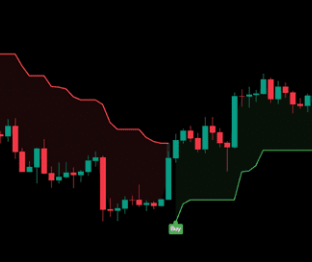
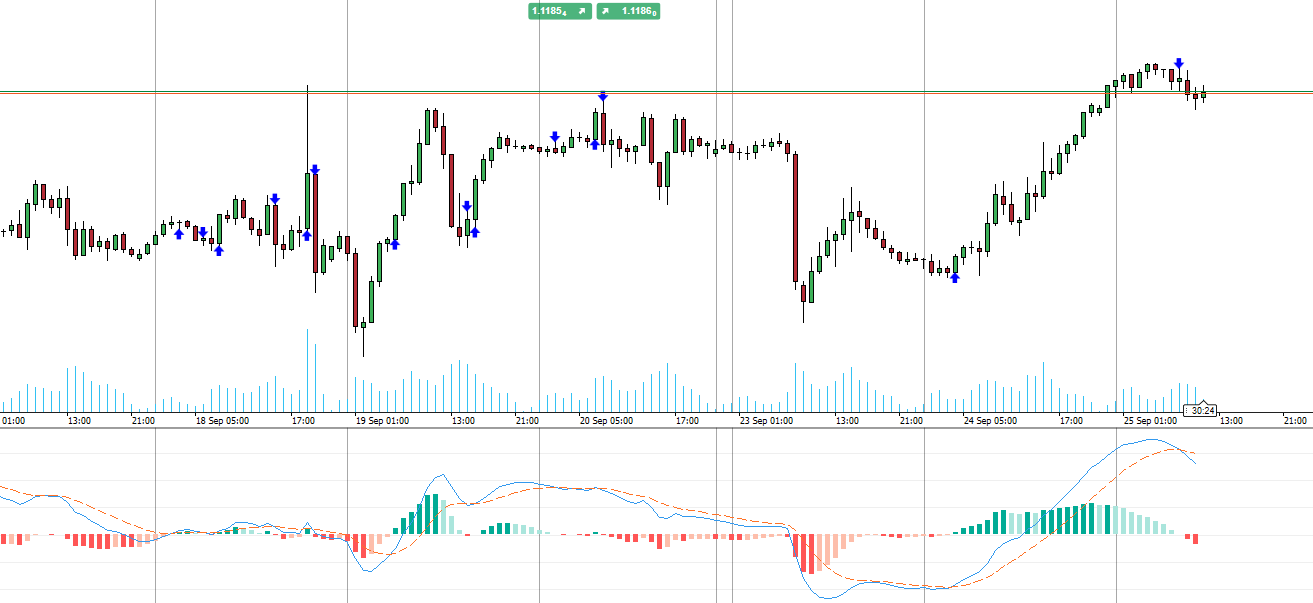
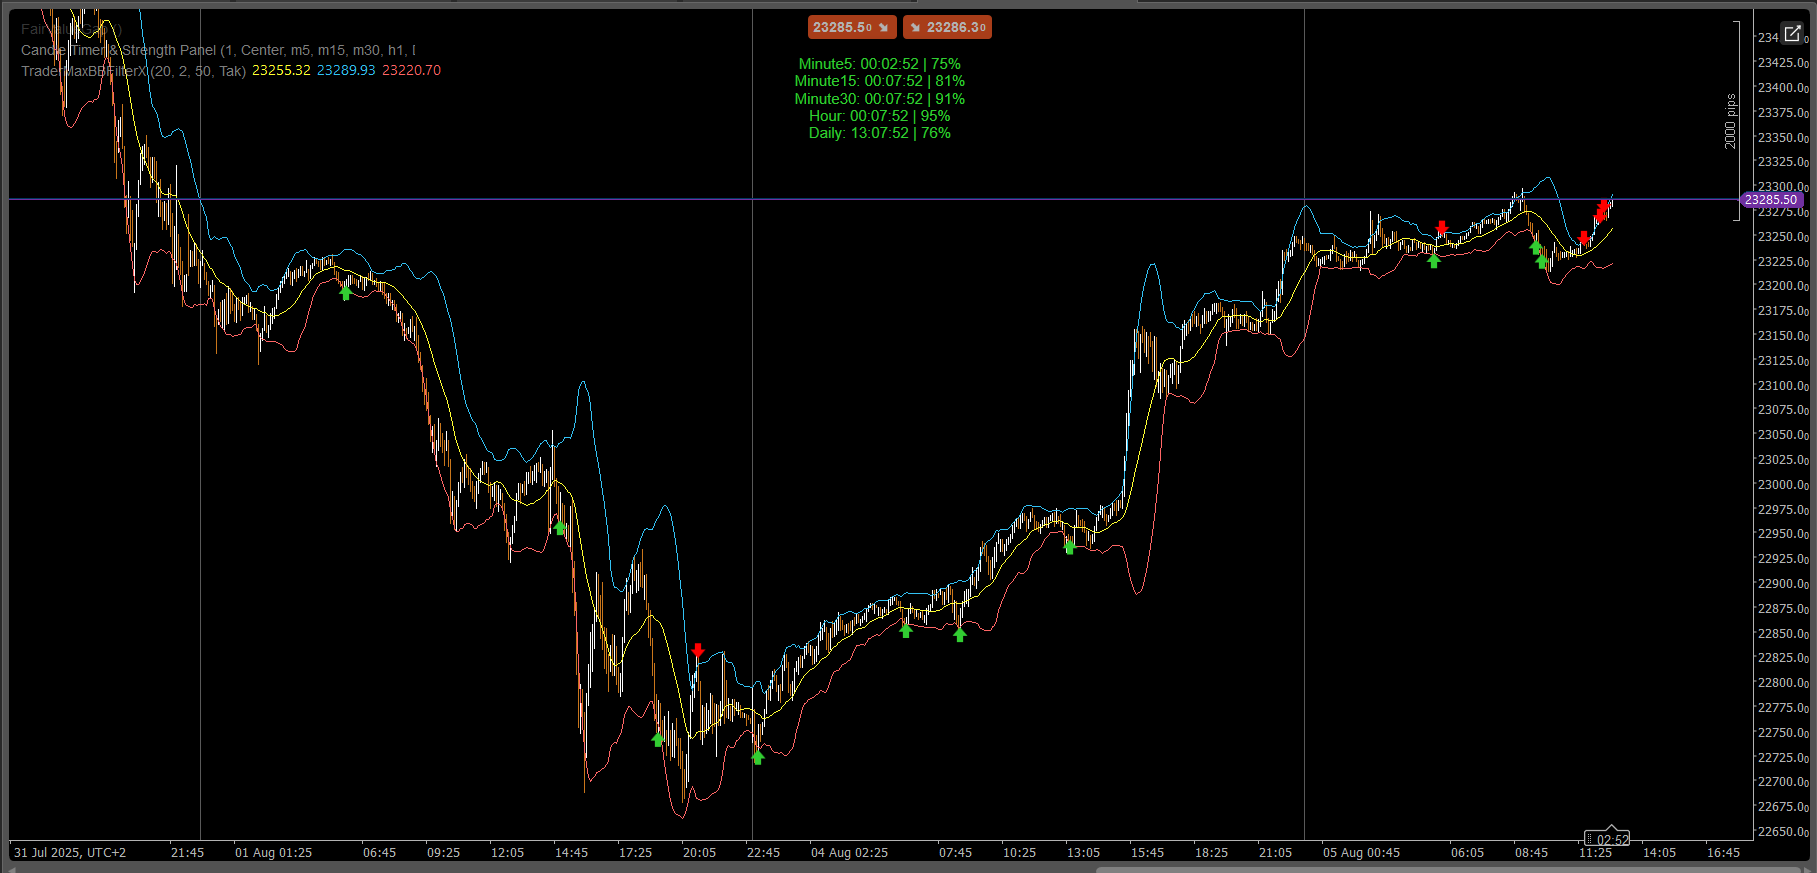
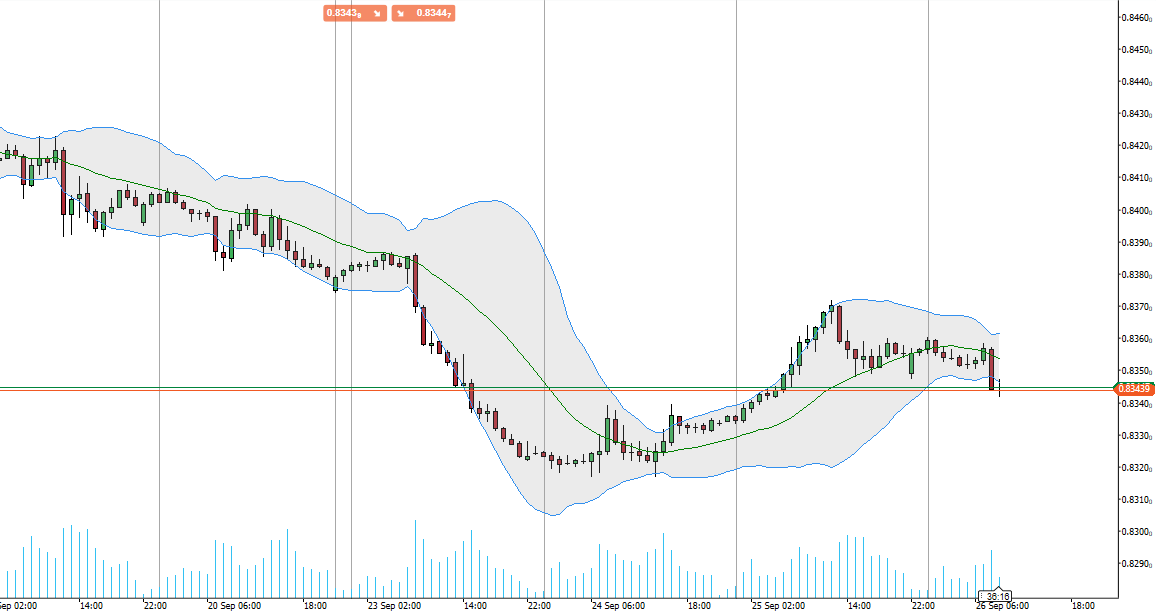
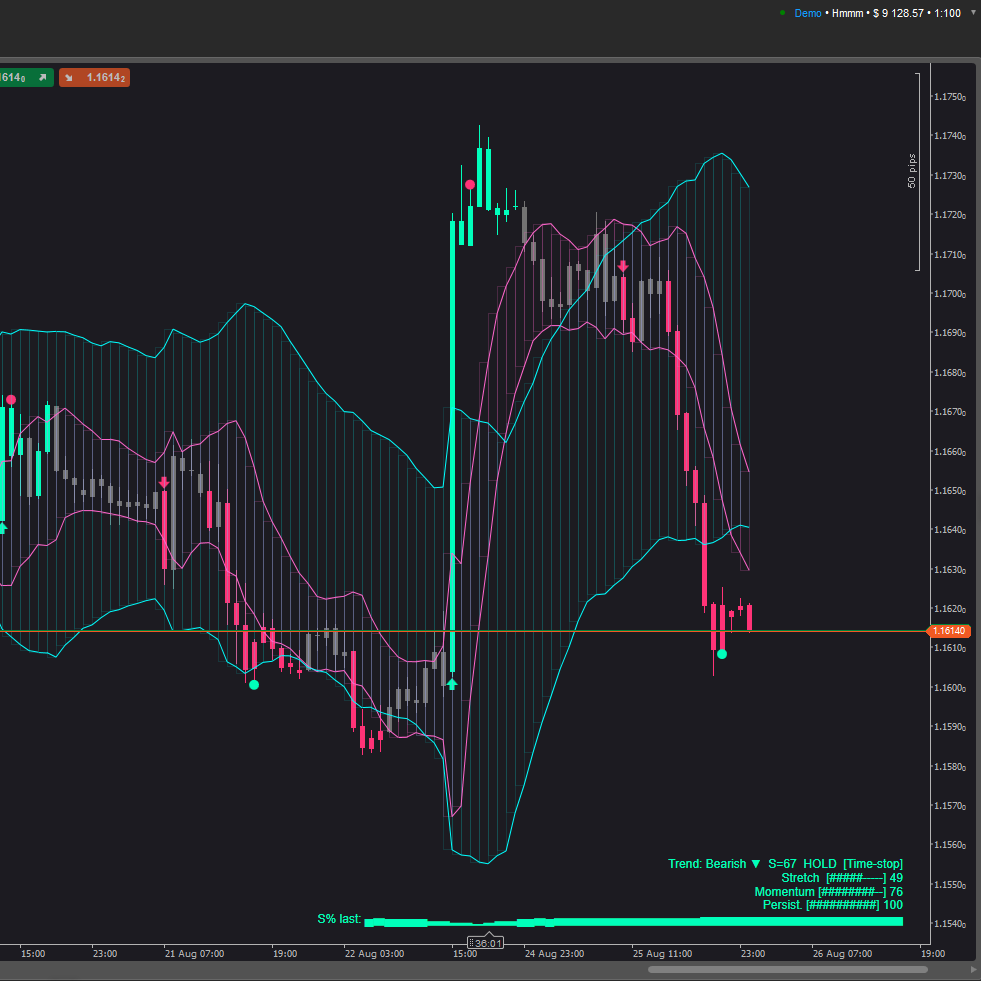
How to Read the Chart:
- When the VIX line breaks above the HighLevel and is accompanied by high volume (green candles), this can signal a potential breakout.
- When the VIX falls below the LowLevel, it may indicate a period of low volatility or market consolidation — ideal for preparing your next move.
More from this author

You may also like

!["[Hamster-Coder] Price" logo](https://market-prod-23f4d22-e289.s3.amazonaws.com/b9c21584-bde2-4113-83c1-d6e5d82a9ca1_Icon300.jpg)