Indicator
forex
eurusd
"EconomicForex" logo
EconomicForex
0.0
03/09/2025
62
Desktop

✔ Website to enter data ,enter the indicators tab: https://tradingeconomics.com/


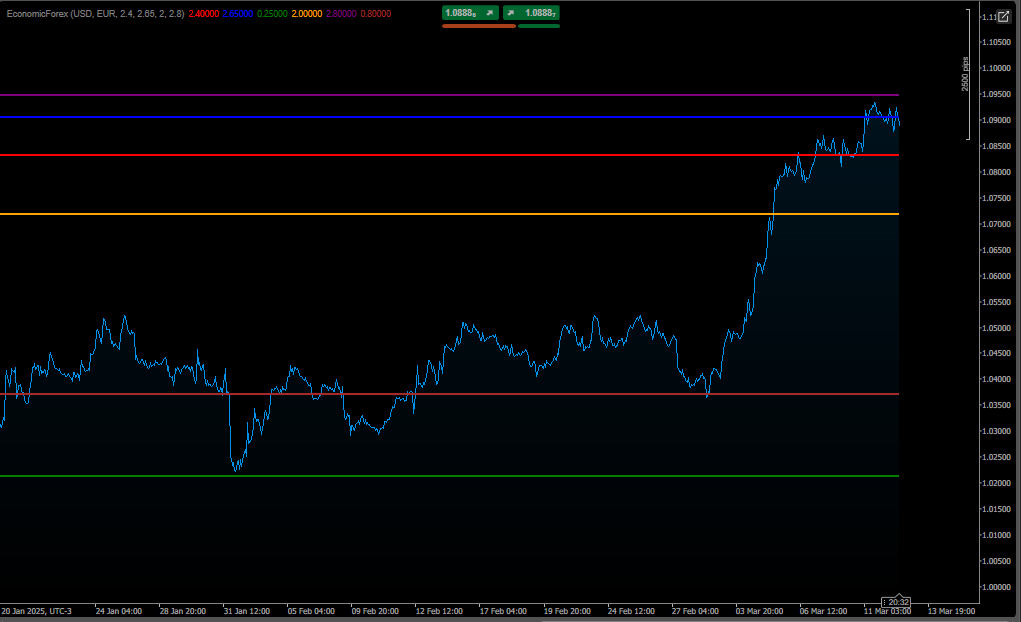
How to Interpret the Graph

Difference between Nominal and Real Interest Rates:

The nominal interest rate is the gross value of the interest rate.

The real interest rate takes inflation into account, showing the real purchasing power of money.

If inflation is higher than the nominal interest rate, the real interest rate will be negative, indicating a loss of purchasing power.

Currency Comparison:

The graph allows you to compare the economic conditions of the two currencies.

For example, if the real interest rate of the main currency is higher than that of the counterpart currency, this may indicate that the main currency is more attractive for investment.

Evolution Over Time:

The lines show how the inflation, nominal interest and real interest rates change over time, allowing you to identify trends.

Usage Example

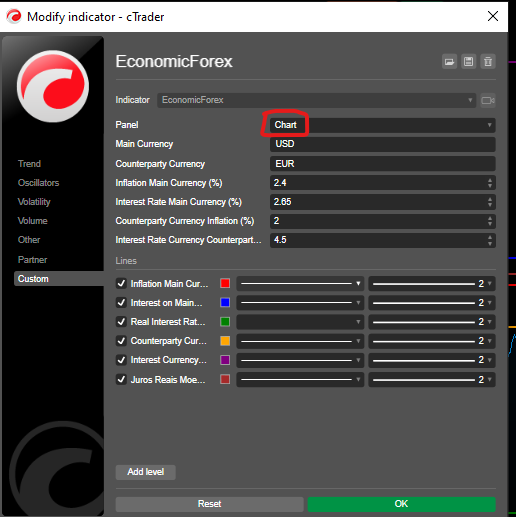
Suppose you set the parameters as follows:

Main Currency: USD (US Dollar)

Inflation: 5%

Nominal Interest Rate: 6.5%

Counterparty Currency: EUR (Euro)

Inflation: 2%

Nominal Interest Rate: 4%

The chart will show:

USD:

Real Interest: 1.5% (6.5% - 5%)

EUR:

Real Interest: 2% (4% - 2%)

With this, you can compare the economic conditions of USD and EUR and make informed decisions in the forex market.

Conclusion

This code is a useful tool for traders and analysts who want to monitor and compare economic indicators of two currencies in a forex pair. It provides insights into inflation, nominal interest rates, and real interest rates, helping to understand the macroeconomic scenario and its implications for the forex market.

see this low risk algorithm:👇🏻

https://ctrader.com/pt/products/601?u=carneiroads

https://ctrader.com/pt/products/623?u=carneiroads

More from this author
Block Order Rreversal
Order BlockIndicator reversal
cBot
breakout
indices
rsi
+1
CHART PATTERN BOT
Chart Patterns Algo Bot
PVA Volume+Analysis_noSourceCode
PVA Volume Analysis Indicator:Price volume over trend strength and direction
cBot
ai
eurusd
Resolver Algo Bot
Resolver Algo Bot,Sophisticated, Perfect algorithm EurUsd! Daily ROI 5 to 24%.
Indicator
signal
Master Dragom SR
Indicator,combines with several strategies.MA locate trends,pullback, signal volumes, reversals, support and resistance
BLOCK LIQUIDITY PRO
Block Liquidity,indicator.Block Order, Liquids Stops, Signal Sentiment,signal correctio.
Blocks Liquidity MGC
BlocksLiquidity Indicator Analysis!
Nexus Prime Bot
Versatile Adaptive System, for Scalper, Long trader, HFT
Indicator
breakout
forex
commodities
+3
MAGIC BLOCK STRATEGY
Block Liquidity,indicator.Block Order, Liquids Stops, Signal Sentiment,signal correction
Pattern Signal Forex
Indicator pattern signal moment
cBot
forex
ai
eurusd
+1
GRADIENTE LINEAR FOREX_noSourceCode
Sophisticated GRADIENTE algorithm , performance 11% per day drawdown 4%
cBot
breakout
forex
ai
+6
Resolver Range PRO
Resolver PRO A.I Bot,Sophisticated, Perfect algorithm! Daily ROI 5 to 24%.Maximum drawdown 4%
cBot
forex
stocks
Quark Forex Paid 1
Quark automatic system Three Strategies
cBot
forex
commodities
stocks
Resolver Range Pro 2.3
Resolver PRO 2.3 Bot,Sophisticated, Perfect algorithm! Daily ROI 5 to 24%.Maximum drawdown 4%.
cBot
forex
ai
eurusd
+3
NEBULA EDGE IA
Adaptive decision-making AI ROBOT that evolves with the market, dynamic risk management and ML optimization.
cBot
forex
stocks
Linear Gradiente v3
GRADIENTE LINEAR algorithm , performance 11% per day drawdown 4%
Indicator
signal
DARK POLL SIGNAL_noSourceCode
Dark Poll Signal Indicator.liquidity leakage,precedes the great movement, accumulation, distribution
You may also like
Market Entropy
Market entropy + DC. Spot crystallization/chaos shifts with an optional on-chart overlay.
VWAP Tabajara
VWAP Tabajara
price quote
price quote
Indicator
breakout
scalping
SSL Channel
SSL Channel — Trusted by price action traders to stay on the right side of the trend.
ZigZag Price Liquidity Projection
📊 ZigZag Liquidity Projection: Predict bounces/breaks using pivots, ATR & volume.
Indicator
signal
macd
TradingViewMACD
Enhance your trading strategy with our customizable TradingViewMACD indicator. Optimize and elevate your market analysis
Ten Thousand Functions Bands Cloud(First Edition)
A metric that can set 1 to 3 groups of Bollinger Bands
Indicator
bollinger
RT Qualitative Quantity Estimation
Unlock trading precision with QQE! Dual QQE indicators with a Bollinger Bands zero line provide clear buy/sell signals.
VegaXLR - Fibonacci Alerts
Alerts you when price touches Fibonacci levels. Stay organized and trade efficiently!
RT MACD
Customize the MACD! Choose colors, get real-time tick updates, and see crossover points for enhanced trading precision.
DMG Indicator POSIZIONE APERTE e Prezzi ,SU GRAFICO
Visualizzazione delle Posizioni dei simboli attivi su grafico
IR CheckList
you could put your check list in your chart you could split your test with “,” you could put your checklist in indicat
Auto Fibonacci Retracement
Auto Fibonacci Retracement Indicator for cTrader
Indicator
commodities
xauusd
atr
+1
[Stellar Strategies] Visual Trend Momentum
Visual Trend Momentum is a MA/ATR/Volume trend tool. Visual signals for strong trends & reversals. Customizable. 📈📉
Market BIAS Detector
The Market BIAS Detector is a smart trading assistant designed to identify the market.
IR Ichimoku Macd
this indicaotr show distance between Tenkan to Kijun, Close to Kijun and Close to Tenkan 
HMA MTF 2.0
HMA MTF 2.0 (Multi-Timeframe )