present
Regístrese y obtenga 50 $ de descuento en su primera compra
Trading product for PRICE LADDER PRO 3.1 Indicador Key Levels ATR, image 1
PRICE LADDER PRO 3.1
Indicador
Versión 1.0, Apr 2026
Windows, Mac
4.5
Valoraciones: 2
Trading product for PRICE LADDER PRO 3.1 Indicador Key Levels ATR, image 2
Trading product for PRICE LADDER PRO 3.1 Indicador Key Levels ATR, image 3
Trading product for PRICE LADDER PRO 3.1 Indicador Key Levels ATR, image 4
Trading product for PRICE LADDER PRO 3.1 Indicador Key Levels ATR, image 5
Desde 20/09/2024
143
Ventas
17.68K
Instalaciones gratis

Descripción

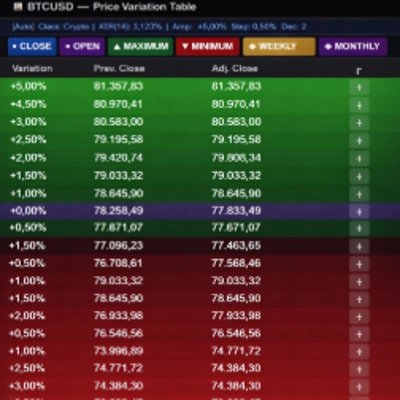
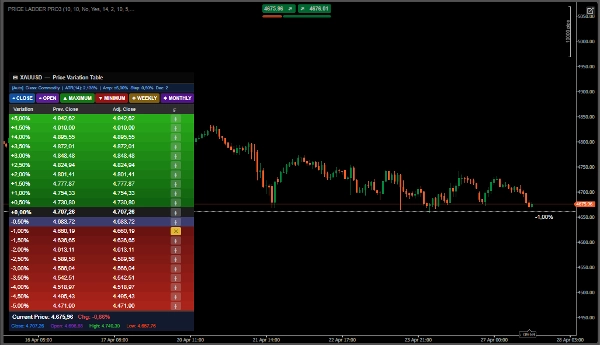
Esta es una herramienta de lectura de precios institucional basada en niveles porcentuales + referencia de liquidez.


🧠 Reconocimiento de Clase de Activos

Forex, Cripto, Índices, Commodities, Acciones, Futuros


🔎 LO QUE REALMENTE HACE ESTE INDICADOR

Transforma el mercado en:

1. 📊 Zonas porcentuales desde el cierre anterior

Ej: +0.5%, +1%, -1%, -2%...

Esto crea una especie de mapa de expansión de precios


👉 Esto es MUY usado por inversores institucionales (volatilidad diaria implícita)

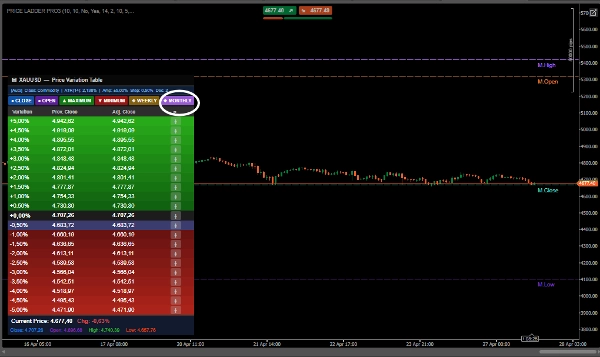
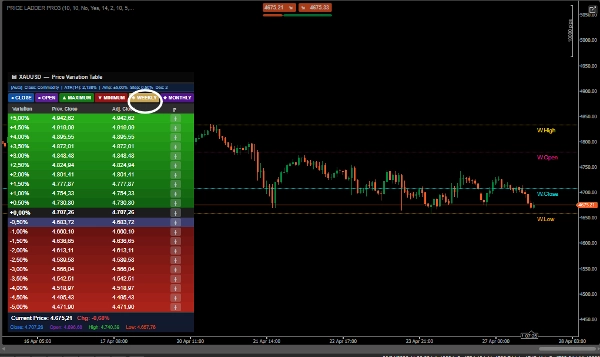
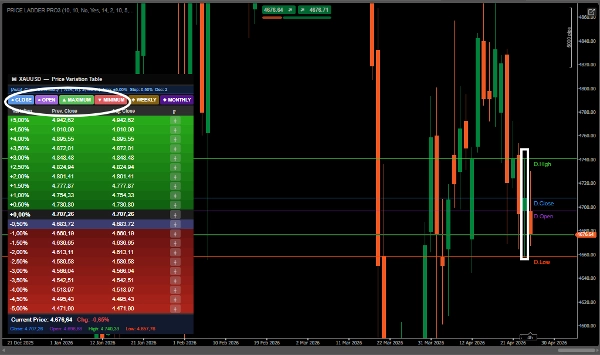
📍 Niveles clave automáticos


Puedes activar:

Cierre anterior

Apertura anterior

Máximo/mínimo

Rango semanal


👉 Esto = liquidez + referencia institucional


3. 🎯 Líneas personalizadas (botón ╋)

Puedes marcar manualmente niveles importantes


👉 Esto se convierte en soporte/resistencia dinámico

🧠 MEJORES ESTRATEGIAS PARA USAR


1. 🚀 Estrategia BREAKOUT Y EXPANSIÓN (la mejor)

Cómo usar:

Conecta:

Cierre anterior

Máximo / mínimo

Semanal o mensual

Nota:

Si el precio rompe:

Máximo anterior

+1% / +1.5% / +2% (cálculo automático de variación por activo)


👉 Esto indica expansión institucional


2. 🔄 Estrategia REVERSIÓN (reversión a la media)

Este indicador es excelente para esto.

Cómo usar:

Si el precio alcanza:

+2% / +3%

o -2% / -3%


👉 Alta probabilidad de:

Retroceso por agotamiento

Entrada:

✔ Venta:

Región +2% o más

Con rechazo (mecha/vela)

✔ Compra:

Región -2% o menos

Objetivo:

Regresar a:


👉 0% (cierre anterior)

👉 Esto funciona MUY bien en:

XAUUSD EURUSD en movimiento lateral


3. 🏦 Estrategia INSTITUCIONAL (mejor uso en el mundo real)

Aquí es donde tu indicador brilla.

Concepto:

Los inversores institucionales piensan así:

¿Dónde está el precio respecto al día anterior?

¿Cuánto se ha expandido?

Todavía hay margen de mejora.

Características principales de la Estrategia Turtle:


1. Niveles de ruptura automáticos

Muestra el máximo y mínimo del período anterior (ayer/semana/mes)

Muestra cierre y apertura como puntos de referencia

Perfecto para identificar rupturas de 20/55 días (puedes adaptar esto)


2. Niveles de expansión por variación porcentual

Similar al concepto de unidad de volatilidad de Turtle

Permite ver niveles de precio con variación X%

Útil para establecer objetivos de ganancia (ej., 2% por encima de la ruptura)


3. Botones rápidos

MÁXIMO/MÍNIMO: Muestra niveles de resistencia/soporte

SEMANAL/MENSUAL: Estacionalidad a largo plazo


4. Ajuste automático por ATR

ATR es el corazón de Turtle (posicionamiento por volatilidad)

Calcula automáticamente rangos basados en la volatilidad real


Resumen

Resumen de IA
PRICE LADDER PRO 3.1 is a trading indicator designed to provide institutional-level price analysis across multiple asset classes including Forex, Crypto, Indices, Commodities, Stocks, and Futures. It converts market data into percentage-based price zones relative to the previous close, creating a price expansion map used to identify key levels of liquidity and institutional interest.

Key features include:
- Automatic display of critical price levels such as previous close, open, high/low, and weekly range.
- Customizable lines for marking important support and resistance levels.
- Integration of Average True Range (ATR) for volatility-based automatic range adjustments.
- Quick-access buttons to show maximum/minimum and weekly/monthly levels.

The indicator supports several trading strategies:
1. Breakout and Expansion: Identifies institutional expansion by monitoring price breaks above previous highs and percentage thresholds.
2. Reversal (Mean Reversion): Highlights potential exhaustion pullbacks when price reaches significant positive or negative percentage zones.
3. Institutional Strategy: Emulates institutional investor behavior by tracking price relative to prior periods and expansion levels, aiding in breakout and target setting.

PRICE LADDER PRO 3.1 outputs visual price levels and supports tick data input, facilitating detailed market structure and volatility analysis for professional trading decisions.
Perfil del indicador
Categoría del indicador
Estadísticas
Tipo de resultado
Visualización
Requisitos de datos
Datos de tic
Señales admitidas
Ruptura de nivel

Conversación

Valoraciones de clientes

4.5
Valoraciones: 2
5
50 %
4
50 %
3
0 %
2
0 %
1
0 %
Valoraciones de clientes
May 4, 2026
The idea is fine, just do not expect it to print perfect entries. Half size is enough at the start.
May 2, 2026
Not bad if the rules are already clear. A clean signal can still fail.

Preguntas frecuentes

Key Levels
ATR
Support & Resistance
Los productos disponibles a través de cTrader Store, incluidos bots, indicadores y plugins para operar, son proporcionados por desarrolladores de terceros y están disponibles únicamente con fines informativos y de acceso técnico. cTrader Store no es un bróker, por lo que no proporciona asesoramiento de inversión, recomendaciones personales ni ninguna garantía de rentabilidad futura.

Más de este autor

cBot
Forex
BTCUSD
+5
Intelligent negotiations and analysis!This robot is 50% automatic.
47.3%
ROI
3
Factor de beneficio
cBot
XAUUSD
Scalping
Precision Scalper,XAUUSD ,Averages that functions like a multidimensional radar:
34.8%
ROI
2.12
Factor de beneficio
Indicador
Order BlockIndicator reversal
cBot
ATR
RSI
+4
Intelligent system, Available any instrument. Profit 12. Drawdown 1%
12.29
Factor de beneficio
Indicador
Forex
Fair Value Gap
Volume Profile Price Period and Live VAH,VAL,POC,
cBot
RSI
MACD
+2
Chart Patterns Algo Bot
Indicador
SMC
Prop
+12
BoS ChoCH Pro,Strict Mode,False Breakout Filter,Average hit rate: 72-78%
cBot
AI
XAUUSD
POSITION 5000 Pips: The Ultimate Algorithm for Gold
54%
ROI
5
Factor de beneficio
Indicador
PVA Volume Analysis Indicator:Price volume over trend strength and direction
Indicador
Forex
BTCUSD
+5
INDICATOR,LIQUIDITY POOLS,ACCURATE SIGNAL, NO DELAY,80% PROBABILITY
Indicador
Signal
Indicator,combines with several strategies.MA locate trends,pullback, signal volumes, reversals, support and resistance
cBot
EMA
BTCUSD
+5
Precision Scalper Bots QUANT ,XAUUSD ,
13.8%
ROI
3
Factor de beneficio

Puede interesarle

Indicador
Prop
Forex
+12
Identify and trade breakouts with Consolidation Zones! Visualize price consolidation areas for trading opportunities.
Indicador
ADX
ATR
+5
Configure, simulate, and analyze trading strategies with custom filters, multi-target exits, and detailed performance me
Indicador
RSI
SMC
+17
RSI, MACD, Stochastic, CCI & Momentum divergence scanner with confluence scoring. Never miss a signal again!
Indicador
Forex
BTCUSD
+4
This indicator is designed to perform multiple non-linear regression analysis using four independent variables.
Indicador
Supertrend
Moving Average
Easy Trade: Trend & Breakout Indicator for cTrader
Logotipo de "RSI Advanced"
Mejor valorado
5.0
(4)
$20
/
$30
Indicador
AI
ATR
+12
The standard Relative Strength Index (RSI), RSI & Signal Cloud, Smart Volatility Filter (ATR), On-Chart Info Dashboard
Indicador
BOS
MSS
+3
Advanced indicator to highlight key execution context and help aligning structure, location, and risk.
Indicador
This indicator is a valuable tool for traders looking to identify significant opening price level of any asset.
Indicador
Prop
Forex
+11
😎Read the description before purchasing💩
Indicador
Market Structure
Support & Resistance
Auto-centers price when it moves beyond threshold. Adjustable zoom. Works on any chart type. Never lose price again.
Indicador
Three ZigZag lines
Indicador
ATR
RSI
+7
Track the Movement of Market Assets with an Oscillator Scanner in Real-Time!
Indicador
AI
SMC
+18
ICT HTF Candles- The Ultimate Multi-Timeframe Dashboard Stop switching timeframes and losing focus.
Indicador
ATR
Wedge
+2
Strong Supertrend Turn Market Movement into a Clear Map Market analysis
Indicador
RSI
RSI on the main chart with 45/55 momentum levels, overbought/oversold levels, averaged RSI, and multi-timeframe support.
Indicador
ATR
Key Levels
It combines the trend-filtering power of Renko charts with the volatility tracking of ATR Bands
Indicador
ATR
RSI
+1
Super Trend Rsi ,ATR + trend change distance + dynamic Alpha, divergence/convergence
Indicador
Prop
Forex
+11
Market Structure Shift – Professional Market Structure Oscillator

Precio

Desde 20/09/2024
143
Ventas
17.68K
Instalaciones gratis