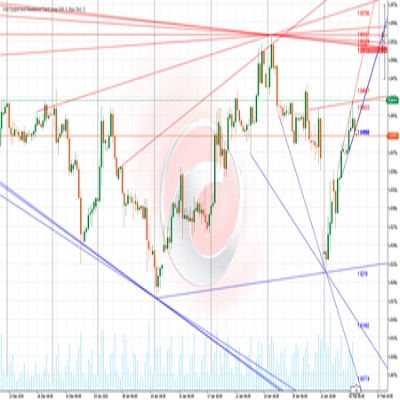
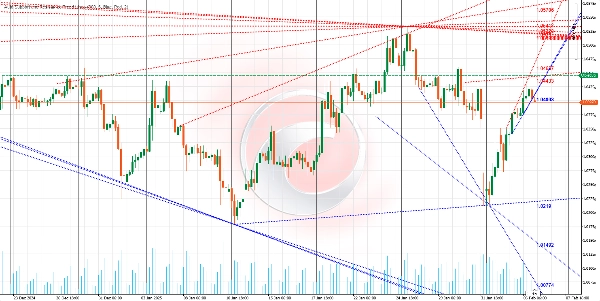
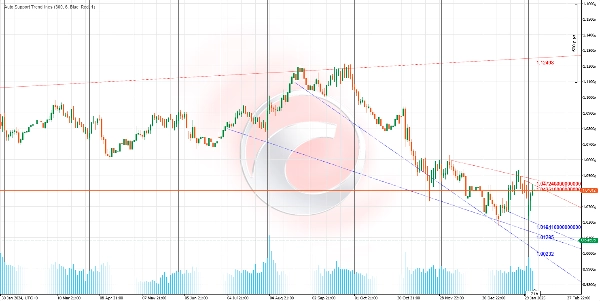
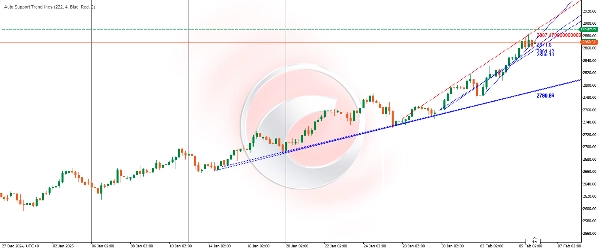
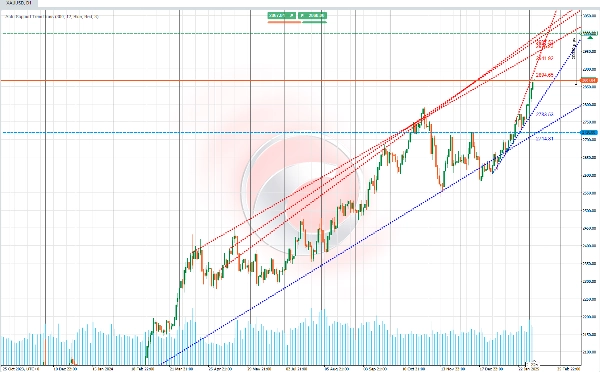
Auto Support and Resistance Trend Lines
Indicateur
Version 1.0, Feb 2025
Windows, Mac
Profil de l'indicateur
0.0
Avis : 0
Avis clients
Il n'y a pas encore d'avis sur ce produit. Vous l'avez déjà essayé ? Soyez le premier à en parler aux autres !
Supertrend
RSI
Les produits disponibles sur cTrader Store, notamment les bots de trading, les indicateurs et les plug-ins, sont fournis par des développeurs tiers et mis à disposition à titre informatif et à des fins d'accès technique uniquement. cTrader Store n'est pas un courtier et ne fournit aucun conseil en investissement, aucune recommandation personnelle ni aucune garantie quant aux performances futures.


Depuis le 03/10/2024
161
Ventes
37.12K
Installations gratuites