
Elliott Wave Indicators for cTrader Analysis
Analyze Elliott Wave indicators for cTrader that support wave counting and market structure review. These forex analysis tools help identify impulse moves, corrections, potential reversal zones and trend continuation setups across active currency pairs.
الأدوات
مقارنة الأدوات
الأسئلة الشائعة



مقارنة الأدوات
المنتج | التقييمات | التنزيلات | المبيعات | السعر | المنصات المتوافقة |
|---|---|---|---|---|---|
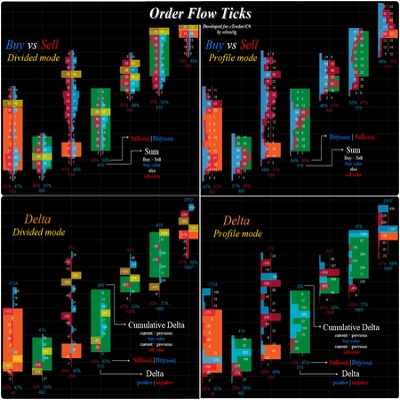
Order Flow Ticks v2.0 | 4.5 (25) | 13.54K | — | مجاني | Windows, Mac |
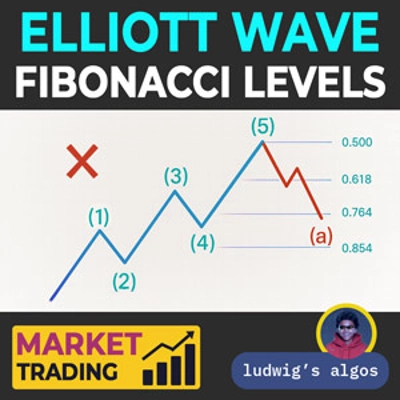
Elliott Wave Fib Auto | 5.0 (1) | — | 15 | $49 | Windows, Mac |
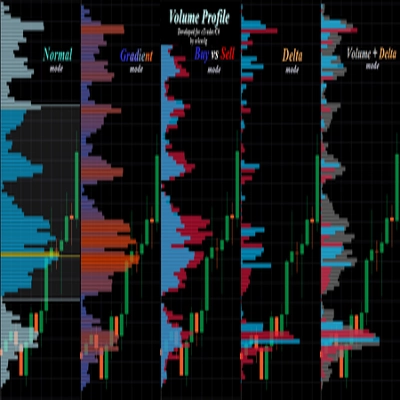
Free Volume Profile v2.0 | 4.8 (10) | 11.16K | — | مجاني | Windows, Mac |
Elliott Waves Auto Detection + Fibonacci | 5.0 (2) | — | 5 | $29 | Windows, Mac |
CRT Pattern Indicator | 4.6 (16) | 6.16K | — | مجاني | Windows, Mac |
Elliot Wave Impulse Pro | 4.3 (4) | — | 4 | $19 | Windows, Mac |
Market Sessions - Free | 4.1 (8) | 5.67K | — | مجاني | Windows, Mac |
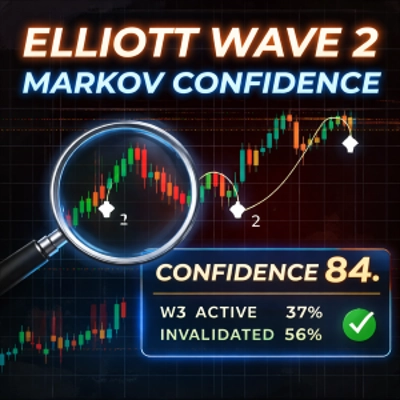
Elliott Wave2 with Markov 5-State Confidence | 5.0 (2) | — | 2 | $24 | Windows, Mac |
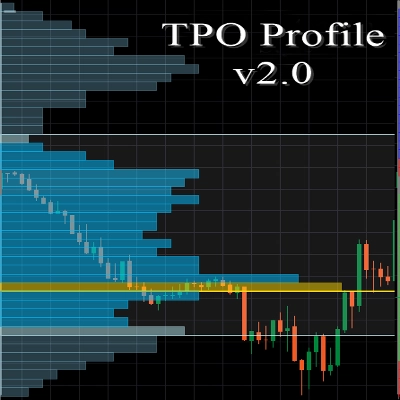
TPO Profile v2.0 | 4.9 (8) | 4.83K | — | مجاني | Windows, Mac |
Akademica Tool Kit 1 | — | — | — | $69 | Windows, Mac |
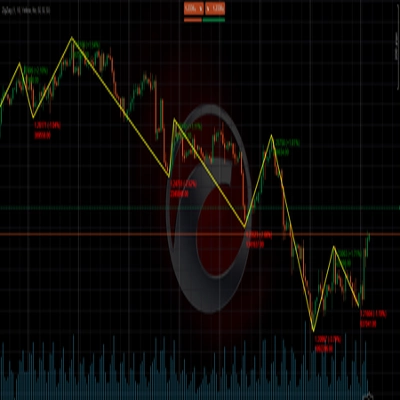
ZigZag | 4.3 (6) | 4.44K | — | مجاني | Windows, Mac |
EWO ABC JP | 4.0 (4) | — | — | $1600 | Windows, Mac |
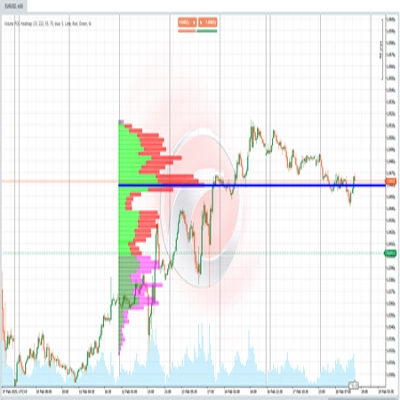
Volume POC Heatmap | 5.0 (4) | 4.13K | — | مجاني | Windows, Mac |
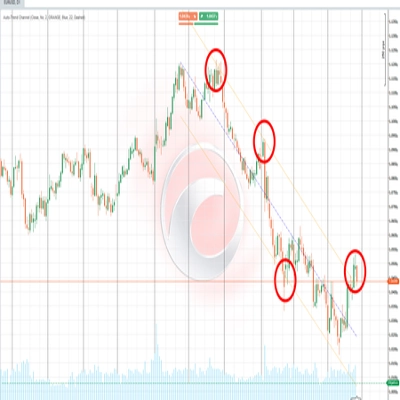
Auto-Trend Channel | 4.4 (5) | 3.08K | — | مجاني | Windows, Mac |
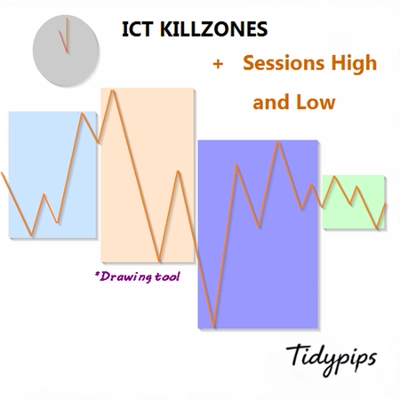
ICT Killzone and Sessions high_low | 3.2 (5) | 2.98K | — | مجاني | Windows, Mac |
Follow Line | 4.5 (6) | 2.81K | — | مجاني | Windows, Mac |
الأسئلة الشائعة
Elliott Wave analysis describes trends as a five-part impulse in the main direction followed by a three-part correction, with patterns nesting inside larger ones on every timeframe. An indicator automates the counting by finding swings and labelling them, which saves time but still produces only one possible count.
Three classic rules apply to an impulse: the second leg never retraces past the start of the first, and the third is never the shortest driving leg. The fourth leg also stays out of the first leg's price territory; tools test swings against these rules and often add Fibonacci ratios as softer guidelines.
Labels depend on which swings the tool treats as complete, and a new high or low can turn a finished-looking correction into part of a larger one. Counts drawn over history therefore appear tidier than live ones, and the same chart often supports several valid counts.
No. It draws labels, channels or projected zones on the chart, and the decision to trade stays entirely with you. Because a count can be relabelled later, many analysts mark the price level that would invalidate their count and accept that losses happen when the market proves it wrong.
Put each on the same symbols in cTrader's Windows or Mac app, then scroll back through history, noting how often labels shifted after the fact. Free and paid versions both exist; a paid description should explain what it adds, such as alerts, Fibonacci targets or labels across several degrees.