
Description
Supply Demand Quadra Zones place un signal d'entrée, un plan de risque dessiné et votre contexte de marché plus large sur un seul graphique.
CE QU'IL DESSINE
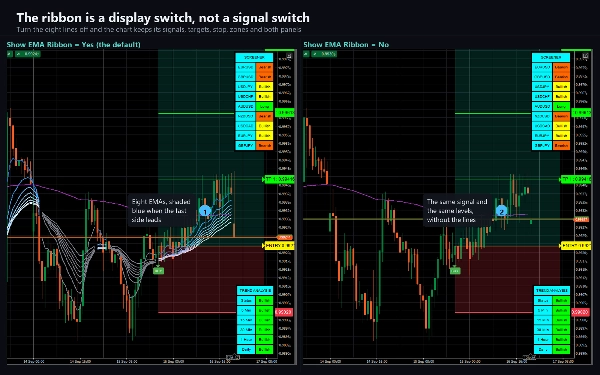
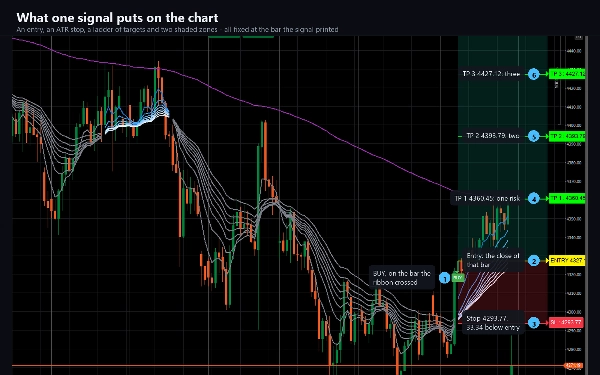
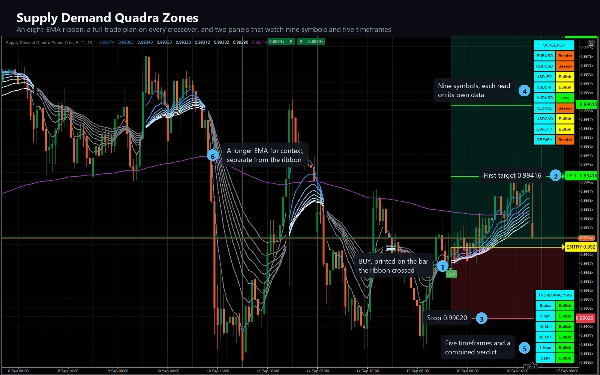
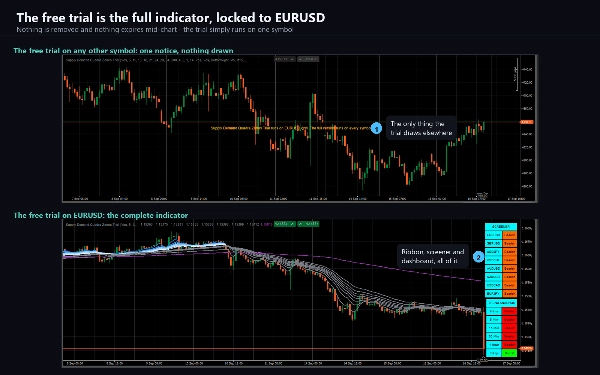
Un ruban EMA à huit lignes (5, 11, 15, 18, 21, 24, 28, 34) qui devient bleu lorsque la jambe rapide mène et gris lorsqu'elle ne le fait pas, plus une ligne de référence de 200 périodes. Lorsque EMA 2 croise au-dessus de EMA 8, une plaque d'ACHAT est dessinée ; lorsqu'il recroise, une plaque de VENTE apparaît.
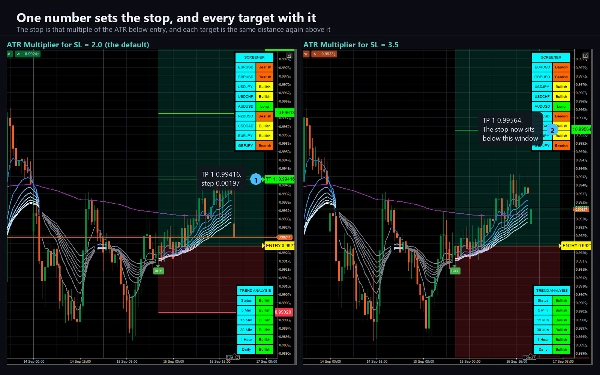
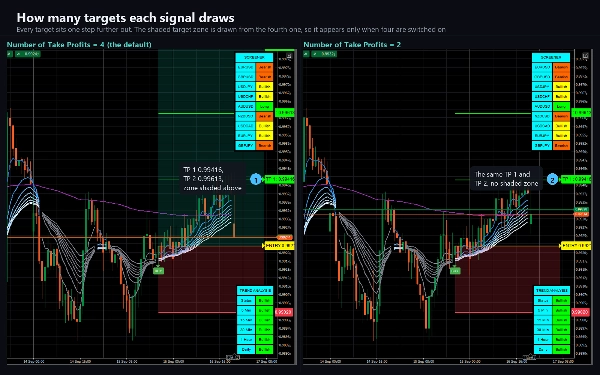
Chaque signal est accompagné d'un plan de risque complet déjà sur le graphique : une ligne d'entrée, un stop placé à un multiple de l'ATR, et jusqu'à quatre niveaux de prise de profit espacés en multiples de cette distance de stop. Aux réglages par défaut, l'échelle est de 1R, 2R, 3R et 4R. Chaque niveau porte son propre prix à l'extrémité droite, et l'espace entre l'entrée et la cible ainsi qu'entre l'entrée et le stop est ombré pour que la forme du trade soit lisible d'un coup d'œil. Le plan entier suit le prix en avant et se fige lorsque le trade se résout - soit le stop est touché, soit chaque cible activée a été atteinte.
LES DEUX PANNEAUX
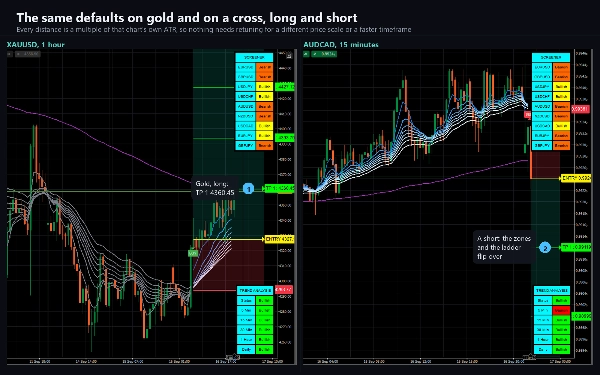
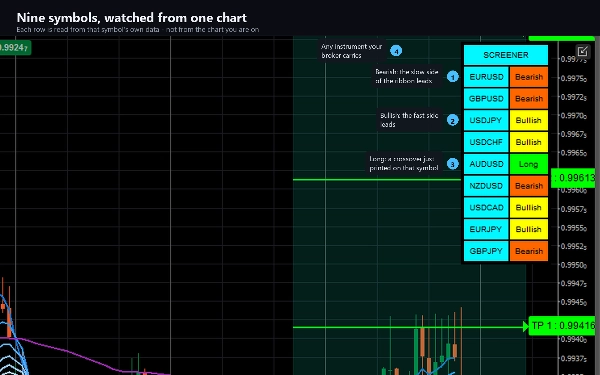
Un filtre classe jusqu'à neuf symboles de votre choix - tous lus à la période du graphique lui-même - comme Long, Short, Haussier ou Baissier, afin que vous puissiez voir quels autres marchés s'alignent de la même manière sans ouvrir neuf graphiques.
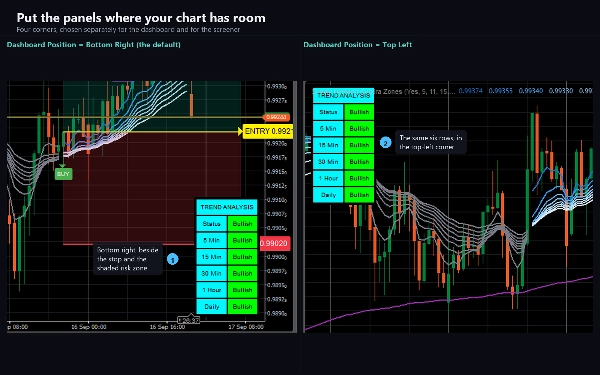
Un tableau de bord de tendance rapporte la direction à 5 minutes, 15 minutes, 30 minutes, 1 heure et quotidienne pour le symbole du graphique, plus une ligne de Statut combinée décidée par un vote majoritaire de trois périodes que vous choisissez.
WEBHOOK
Chaque signal, et chaque étape du trade qui le suit, peut être envoyé en POST au format JSON vers une URL que vous choisissez - ainsi un bot externe, un journal ou un service de notification peut agir sans que personne ne regarde le graphique. Il envoie le côté, l'entrée, le stop et toute l'échelle des cibles, puis un message pour chaque cible atteinte, pour le stop, et pour la clôture du trade. Il est désactivé tant que vous ne remplissez pas l'URL, il ne se déclenche jamais pendant le chargement de l'historique ou lors d'un backtest, et il ne nécessite aucune permission élevée.
Les alertes sont également délivrées via le journal cTrader, un son et un e-mail.
REPEINTURE, DIT CLAIREMENT
Les signaux d'ACHAT et de VENTE ne repeignent pas. Ils sont décidés sur des barres fermées et ne bougent jamais une fois dessinés.
Les deux panneaux repeignent. Les deux sont dessinés sur la barre en direct et lisent les données en cours de développement des périodes supérieures, donc leurs cellules peuvent changer jusqu'à la fermeture de ces barres. Traitez-les comme une image en direct de la situation, pas comme un enregistrement de ce qui s'est passé.
PARAMÈTRES
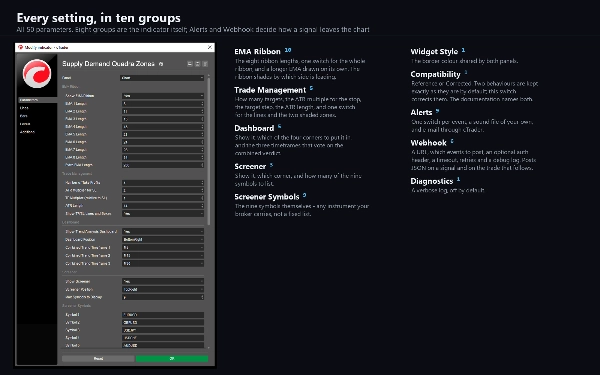
50 paramètres. Toutes les huit longueurs du ruban, le multiplicateur ATR et l'espacement des cibles, le nombre de cibles, les positions des deux panneaux, les neuf symboles du filtre, les trois périodes du tableau de bord, la couleur de la bordure, les canaux d'alerte et le webhook. Un paramètre de Compatibilité choisit entre deux comportements pour l'option du tableau de bord 4 heures et la zone cible ombrée - la documentation explique exactement ce que chacun fait et pourquoi le réglage par défaut est ce qu'il est.
ADAPTÉ À
Tout instrument et toute période proposés par la plateforme. Le ruban nécessite 34 barres avant d'être entièrement formé et 200 pour la ligne de référence, donc les historiques très courts afficheront moins de lignes qu'un long.
Le trading comporte des risques. Les performances passées ne garantissent pas les résultats futurs.
Résumé
Each trade signal includes a comprehensive risk plan displayed directly on the chart, consisting of an entry line, a stop loss set at a multiple of the Average True Range (ATR), and up to four take-profit levels spaced by multiples of the stop distance. These levels are visually shaded and labeled with price tags for clarity. The risk plan dynamically tracks price movement and freezes upon trade resolution.
The product also includes two panels: a screener monitoring up to nine user-selected symbols on the current timeframe, classifying them as Long, Short, Bullish, or Bearish; and a trend dashboard showing directional trends across five timeframes (5m, 15m, 30m, 1h, daily) with a combined status based on a majority vote of three user-chosen timeframes.
Signals and trade steps can be sent as JSON via webhook to external services for automation or logging. Alerts are available through platform logs, sound, and email. Buy and sell signals are confirmed on closed bars and do not repaint, while the screener and dashboard update live and may change until bar close. The indicator offers extensive customization with 50 parameters covering ribbon settings, ATR multiples, target spacing, panel positions, symbols, alert channels, and webhook configuration.