


Descripción
LA IDEA
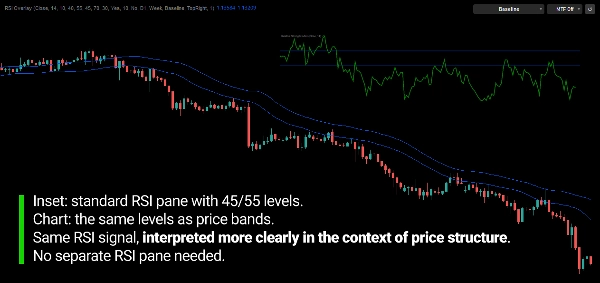
Un RSI que traduce sus niveles en precio y los traza directamente en el gráfico, manteniendo el momentum y el precio en el mismo espacio en lugar de en un panel separado.
EL PROBLEMA
Normalmente, el RSI se lee en un panel separado.
Para usarlo, debes comparar constantemente el valor del oscilador con lo que el precio está haciendo en el gráfico principal.
Niveles como 70, 30 o 50 son números en un oscilador. No te dicen dónde debe estar el precio para que el RSI los alcance.
Así que sigues traduciendo a ojo: "El RSI está en 62 — ¿dónde está eso en el gráfico?"
El problema no es el RSI en sí.
El problema es que el momentum y el precio se muestran en dos lugares diferentes, en dos unidades diferentes.
EL CONCEPTO CENTRAL: LOS NIVELES DEL RSI SE CONVIERTEN EN NIVELES DE PRECIO.
El RSI tradicional pregunta:
"¿Cuál es el valor del RSI ahora mismo?"
RSI Overlay pregunta:
"¿A qué precio alcanzaría el RSI este nivel?"
Cada nivel de RSI se convierte en el nivel de precio correspondiente y se traza directamente en el gráfico.
El oscilador ya no es algo que leas en una ventana y traduzcas en otra.
Su información se expresa en la misma escala de precios que el movimiento que ya estás analizando.
El RSI establece el nivel. El gráfico lo muestra en precio.
LO QUE HACE
RSI Overlay convierte referencias seleccionadas del RSI en niveles de precio dinámicos y los muestra directamente en el gráfico principal.
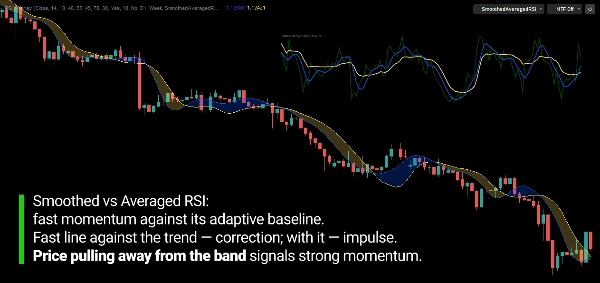
Las líneas base Bull y Bear, los niveles de Sobrecompra y Sobreventa, y dos referencias basadas en RSI, RSI Suavizado y RSI Promediado, se representan todas como líneas de precio.
Las líneas se actualizan con cada nueva barra, por lo que continúan reflejando el estado más reciente del RSI en lugar de permanecer fijas en un precio histórico.
Estos no son niveles convencionales de soporte o resistencia.
Representan el precio al que se alcanzaría el valor correspondiente del RSI bajo el cálculo actual del RSI.
El indicador no intenta predecir hacia dónde irá el precio.
Muestra dónde se encuentra el precio en relación con los niveles de RSI que estás observando.
CÓMO FUNCIONA
- El RSI se calcula usando el suavizado de Wilder.
- Cada nivel de RSI se convierte en el precio que lo produciría.
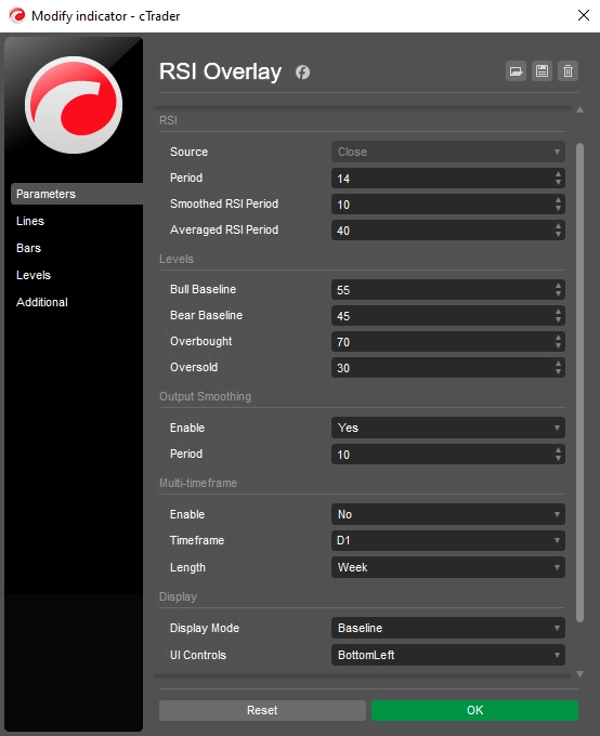
- Las líneas base Bull y Bear marcan la zona de momentum alrededor de la línea central (por defecto 55 / 45).
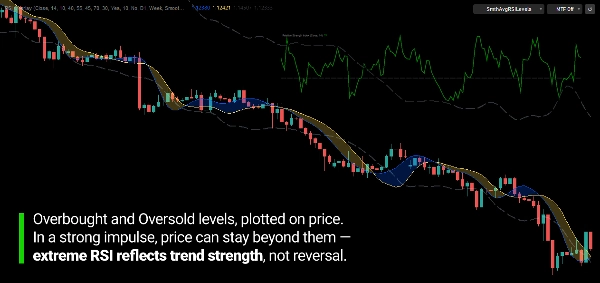
- Los niveles de Sobrecompra y Sobreventa se convierten de la misma manera (por defecto 70 / 30).
- El RSI Suavizado y el RSI Promediado también se convierten en líneas de precio.
LAS REFERENCIAS DEL RSI
Líneas base Bull / Bear
Los niveles de precio en los que el RSI entraría en territorio de momentum alcista o bajista. El espacio entre ellas muestra dónde el momentum es neutral.
RSI Suavizado
Una versión con ruido reducido del RSI, mostrada como una línea de precio que reacciona de manera más suave.
RSI Promediado
Un promedio adaptativo más lento del RSI, mostrado como una línea de precio. Proporciona una referencia de momentum más estable.
Sobrecompra / Sobreventa
Los niveles de precio en los que el RSI alcanzaría los umbrales de sobrecompra y sobreventa.
Estas referencias no son señales automáticas.
Su posición relativa al precio y entre ellas proporciona contexto sobre cómo se está desarrollando el momentum.
CONTEXTO MULTI-TIEMPO
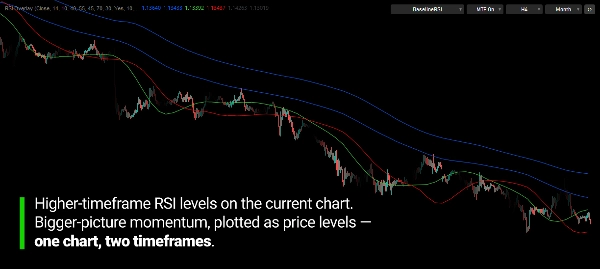
El RSI no tiene que provenir del marco temporal del gráfico que estás viendo.
Por ejemplo, un RSI semanal o mensual puede proyectarse en un gráfico H1.
Esto coloca el marco de momentum de un marco temporal superior directamente sobre la acción del precio que estás observando.
Puedes elegir cuánta historia se dibuja, desde la última hora hasta varios años.
El marco temporal seleccionado debe ser superior al del gráfico.
CONTROLA DESDE EL GRÁFICO
Once modos de visualización te permiten mostrar solo lo que necesitas, desde un par limpio de líneas base hasta el conjunto completo de referencias del RSI.
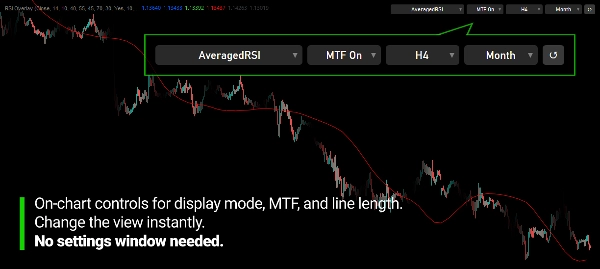
Una barra de control compacta en el gráfico te permite cambiar el modo de visualización, activar o desactivar el multi-tiempo, y cambiar el marco temporal y la longitud sin volver a abrir la configuración.
Un botón de reinicio devuelve todo a tus parámetros iniciales.
La barra puede colocarse en cualquier esquina o ocultarse.
LO QUE PUEDES OBSERVAR
El indicador está diseñado para hacer visibles varias cosas:
- Dónde se encuentra el precio en relación con las zonas de momentum alcista y bajista
- Qué tan lejos está el precio de los niveles de sobrecompra y sobreventa, en términos de precio
- Cambios de momentum alrededor de las líneas base
- Retrocesos y continuaciones en relación con el RSI suavizado y promediado
- Contexto de momentum de marcos temporales superiores en un gráfico de marco temporal inferior
RSI Overlay es una herramienta de medición, no un sistema independiente de compra/venta.
DISEÑADO PARA EL MOMENTUM EN TÉRMINOS DE PRECIO
El propósito no es reemplazar el RSI.
Es eliminar la necesidad de traducir un oscilador de nuevo a precio a ojo.
Todo lo que sabes sobre el RSI sigue aplicando. Simplemente se muestra donde realmente se toman las decisiones: en el gráfico de precios.
CARACTERÍSTICAS PRINCIPALES
- Niveles de RSI convertidos en niveles de precio en el gráfico principal
- Líneas base Bull y Bear (por defecto 55 / 45)
- Niveles de precio de Sobrecompra y Sobreventa (por defecto 70 / 30)
- Línea de RSI Suavizado
- Línea de RSI Promediado
- RSI multi-tiempo en gráficos de marcos temporales inferiores
- Longitud de visualización seleccionable para líneas multi-tiempo
- 11 modos de visualización
- Barra de control en el gráfico con reinicio
- Fuente configurable, período de RSI, suavizado y promediado
- Colores, estilos de línea y grosor personalizables
---
El trading implica riesgos. Este indicador es una herramienta de análisis técnico y debe usarse junto con una gestión de riesgos adecuada.
Resumen
It supports multi-timeframe analysis by allowing RSI data from higher timeframes (e.g., weekly or monthly) to be displayed on lower timeframe charts, providing broader momentum context. Users can customize display modes, line styles, colors, and control parameters directly from an on-chart control bar, which includes options to reset settings and adjust timeframe and length without reopening menus.
RSI Overlay serves as a measurement tool to visualize where price stands relative to momentum zones and RSI thresholds in price terms. It does not generate automatic trading signals but aids in observing momentum shifts, pullbacks, and continuations aligned with RSI levels on the price chart.
Valoraciones de clientes
5 | 100 % | |
4 | 0 % | |
3 | 0 % | |
2 | 0 % | |
1 | 0 % |
Conversación
Preguntas frecuentes




















![Logotipo de "High-Low Divergence [Iridio Capital]"](https://cdn.ctrader.com/image/webp/10a9e91b-243a-43f6-bbfe-7376bad5a214_61554)

Precio