present
新規登録で初回購入時に$50オフ
Trading product for DayContextPro インジケーター Key Levels Support & Resistance, image 1
DayContextPro
インジケーター
1 ダウンロード数
バージョン 1.1、Oct 2026
Windows、Mac
Trading product for DayContextPro インジケーター Key Levels Support & Resistance, image 2
Trading product for DayContextPro インジケーター Key Levels Support & Resistance, image 3
登録日 09/03/2026
48
無料インストール

説明

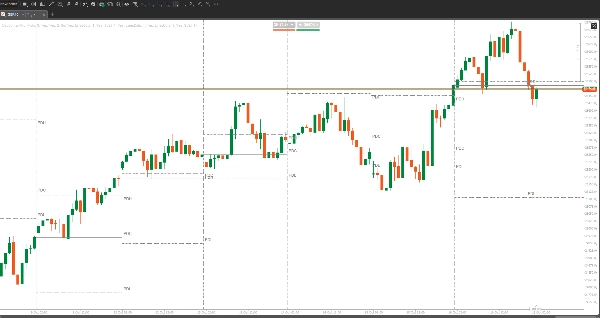
DayContextPro gives intraday charts a clean daily structure. It marks where each trading day and week begins, and carries the previous day’s high, low and close into the next day. These lines are drawn for every day in the chart’s history, not just today, so you can scroll back and see how price reacted to these levels day after day.

Indicator type: Price action and support/resistance (chart overlay)
Preferred instruments: FX pairs, gold, indices and any symbol with a daily session
Preferred periods: M1 to H1. The indicator draws nothing on H2 and above.
Platform: cTrader Windows and Mac (desktop only)

Trading use cases

  • Seeing where each day and week starts at a glance
  • Watching how price reacts at the previous day’s high, low and close
  • Reviewing past days to study breakouts, sweeps and rejections at these levels
  • Planning targets and stops around the previous day’s range

What it draws

  • Day separator: a lines-dots vertical line at the start of each trading day
  • Week separator: a solid vertical line at each week boundary
  • Previous day high and low (PDH/PDL): lines-dots lines across the following day
  • Previous day close (PDC): a solid line across the following day

Each day’s levels span that day only, so past days stay easy to read. Today’s levels run to the right edge of the chart. PDH, PDL and PDC labels show for today, with an option to label past days too.

Accurate trading days
Days follow your broker’s own daily candles, so the lines match its D1 chart. On brokers with a short Sunday candle, that candle counts as part of Monday, so Friday’s levels carry into Monday as they should.

Colors that fit your chart
In Auto mode, lines are grey on a light chart and white on a dark chart. They update straight away if you switch theme. In Custom mode, every line type has its own color.

Settings

  • Show or hide each line type
  • Colour, line style and thickness for each line type
  • Number of past days to draw (all by default)
  • Label options

Notes

  • The indicator does not place trades or predict price.
  • Previous day levels are reference points, not signals. Always use proper risk management.

Trading involves risk. Past performance does not guarantee future results.

概要

AI summary
DayContextPro is a chart overlay indicator designed for cTrader desktop (Windows and Mac) that enhances intraday price action analysis on M1 to H1 timeframes. It visually structures intraday charts by marking the start of each trading day and week with vertical separator lines. The indicator also plots the previous day’s high, low, and close levels as horizontal lines extending across the following day, allowing traders to observe how price interacts with these key reference points over time.

Key features include:
- Day separators (lines-dots vertical lines) and week separators (solid vertical lines).
- Previous day high and low (PDH/PDL) shown as lines-dots lines.
- Previous day close (PDC) shown as a solid horizontal line.
- Levels are drawn for every day in the chart history, not just the current day.
- Labels for today’s PDH, PDL, and PDC with optional labels for past days.
- Automatic color adaptation to chart theme or customizable colors and line styles.
- Settings to show/hide line types, adjust colors, line thickness, and number of past days displayed.

The indicator uses the broker’s daily candle definitions to ensure accurate daily boundaries. It supports FX pairs, gold, indices, and any symbol with a daily session. DayContextPro does not generate trade signals or place trades; it provides visual reference levels to assist with planning targets, stops, and studying price behavior around previous day ranges.

インジケーターのプロフィール

カスタマーレビュー

0.0
レビュー: 0
カスタマーレビュー
この商品にはまだレビューがありません。お使いになったことがある方は、ぜひレビューをお願いします。

ディスカッション

よくあるご質問

Key Levels
Support & Resistance
cTrader Storeで入手可能な取引ボット、インジケーター、プラグインなどの商品は、第三者の開発者が提供するものであり、情報と技術の取得のみを目的としてご利用いただけます。cTrader Storeはブローカーではなく、投資助言や個人的な推奨を行うことも、将来のパフォーマンスを保証することもありません。

この作成者の他の商品

インジケーター
Key Levels
Every major liquidity level drawn for you: PDH/PDL, PWH/PWL, PMH/PML and more. Same price on every timeframe. Free.
デスクトッププラグイン
Prop Firm Fit
Trade Journal
+1
Paper trade your broker’s live prices in cTrader: demo accounts, prop challenges, a stats dashboard and trading journal
インジケーター
Fair Value Gap
Auto-draws every Fair Value Gap on any timeframe and removes it once filled. Clean, fast, free. Built for cTrader.
デスクトッププラグイン
Trade Journal
Trade Statistics
Track. Analyze. Improve. A journal and statistics for your real cTrader trades, with a prop challenge guard.
インジケーター
EMA
Outlines the first candle of the real session open for indices, forex & crypto. Auto DST, HTF candle panel & EMA.
インジケーター
EMA
Flag
+2
Liquidity levels, trend lines, filtered chart patterns and a composite bias HUD in one cTrader overlay.
デスクトッププラグイン
SL Manager
Risk/Reward
+5
Drag SL & TP on the chart, see risk, reward, R:R and lot size live, then place Buy or Sell orders in one click
インジケーター
BOS
CHOCH
+5
SMC structure indicator for cTrader: BOS/CHoCH, order blocks, FVGs, liquidity sweeps, key levels and alerts.
デスクトッププラグイン
Chart UI Tools
Replay your broker’s charts candle by candle. Rewind any time, switch timeframes and practise trades with full stats.

これも好きかも

インジケーター
Prop
Forex
+12
⚡ ADXVMA Aurora Trend Filter combines ADX trend strength with an adaptive EMA blend ⚡
インジケーター
ATR
RSI
+6
💹 Define a price channel 📈 and determine trend direction (bullish 🟢 or bearish 🔴).
インジケーター
RSI
VWAP
+5
📈 Anchored VWAP with auto High/Low, session resets, Daily VWAP & TWAP — precise, Pine-accurate port.
インジケーター
Order Block
Fair Value Gap
+1
This indicator contains most of the ICT strategies that you need. You can turn on/off each one to be shown.
インジケーター
AI
RSI
+7
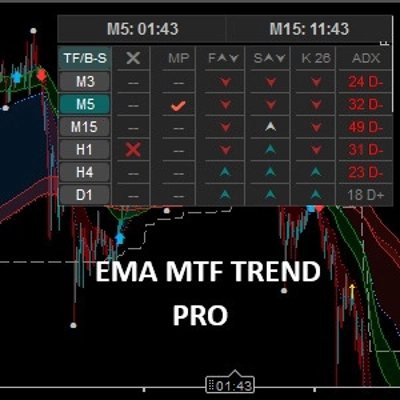
EMA MTF TREND PRO - Multi-timeframe trend analysis overlay indicator, 6 timeframes - in one table with ADX
インジケーター
SMC
Prop
+5
ADVANCED ICT + ADR + AWR SUITE PRO (The Ultimate All-in-One Toolkit for Price Action Traders)
インジケーター
SMC
Forex
+5
Pinpoint FVGs, track fills and see mitigation stats — trade imbalances with clarity and confidence.
インジケーター
Key Levels
Market Structure
+1
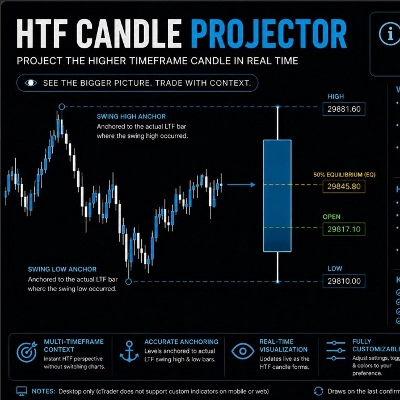
HTF Candle Projector displays the current Higher Timeframe candle (4H or 1H) as a real projected candle LIVE..
インジケーター
AI
ATR
+27
SR Commander is a clean and intelligent support and resistance indicator for cTrader, built to help traders identify key
インジケーター
Forex
GBPUSD
+3
Support & resistance zones with measured hold rates and confidence intervals — evidence, not just lines on a chart.
インジケーター
Auto Fibonacci Retracement Indicator.
「MARainbow」ロゴ
トップ評価
4.2
(4)
$19
/
$38
インジケーター
Forex
Crypto
+3
MARainbow gives you the edge with four customizable moving averages—each color-coded for instant recognition.
インジケーター
Volume
Key Levels
+1
Session Volume Profile for London and New York sessions showing POC levels
インジケーター
Auto-detect supply & demand zones, remove broken levels, and trade smarter with real-time alerts. Precision made simple.
インジケーター
Forex
Crypto
+2
PREMIUN INDICATOR
インジケーター
Forex
EURUSD
+2
DXY HMA Indicator
インジケーター
EMA
Volume
+4
Advanced volume‑profile tool with delta, HVN/LVN zones, and precise POC‑based trade signals.
インジケーター
Doji
Volume
+5
Instantly spot high-liquidity institutional moves with clean, non-obtrusive triangle alerts on cTrader charts.

価格

登録日 09/03/2026
48
無料インストール