

Descrizione
# 🚀 Indice di Slittamento Cinetico (KSI) – Strumento Avanzato di Analisi della Pressione di Mercato e della Liquidità
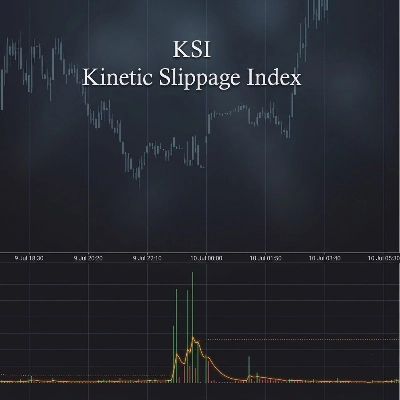
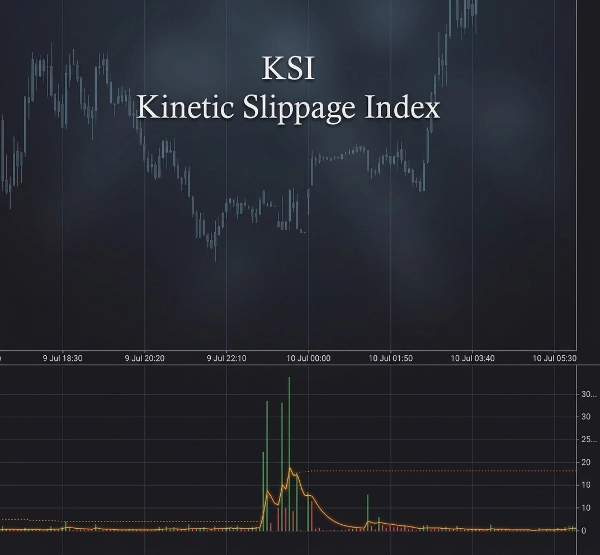
Sblocca approfondimenti di mercato più profondi con il **Kinetic Slippage Index (KSI)** — un potente indicatore di trading progettato per identificare movimenti di prezzo insoliti, squilibri di volume e potenziali eventi di liquidità prima che diventino evidenti sul grafico.
Creato per trader che analizzano **struttura di mercato, comportamento del volume, volatilità e attività istituzionale**, il KSI combina l'espansione del range e la dinamica del volume per misurare condizioni di mercato anomale.
## 🔥 Caratteristiche Principali
✅ **Calcolo dell'Indice di Slittamento Cinetico**
* Misura la relazione tra movimento del prezzo e volume scambiato.
* Rileva situazioni in cui il prezzo si muove in modo sproporzionato rispetto al comportamento normale del volume.
* Aiuta a identificare potenziali stress di liquidità, attività di mercato aggressive e slanci insoliti.
✅ **Rilevamento Adattivo dei Picchi**
* Calcola automaticamente livelli dinamici di picco basati sul comportamento recente del mercato.
* Utilizza l'analisi della deviazione statistica per evidenziare eventi di mercato estremi.
* Si adatta alle condizioni di volatilità variabili senza richiedere aggiustamenti manuali costanti.
✅ **Avvisi di Picco in Tempo Reale 🚨**
* Ricevi notifiche quando si verifica una divergenza anomala tra volume e range.
* Aiuta i trader a identificare rapidamente potenziali condizioni di breakout, acquisizioni di liquidità o improvvisa pressione di mercato.
✅ **Analisi di Volume e Flusso 📊**
* Monitora il volume attuale rispetto alla sua media EMA.
* Evidenzia quando l'attività di trading è insolitamente alta.
* Include l'analisi delta cumulativa per visualizzare la pressione di acquisto e vendita.
✅ **Conferma della Linea di Segnale 📈**
* Il calcolo del segnale smussato aiuta a identificare i cambiamenti nel momentum del KSI.
* La visualizzazione con istogramma verde/rosso rende facile leggere i cambiamenti di pressione di mercato.
## 🕒 Intelligenza della Sessione di Trading
KSI include il tracciamento automatico delle sessioni di mercato:
🌏 Sessione Asia
🇬🇧 Sessione Londra
🇺🇸 New York AM
☕ Pausa pranzo New York
🌆 New York PM
La visualizzazione integrata della killzone aiuta i trader a capire quando la liquidità e la volatilità sono tipicamente più elevate.
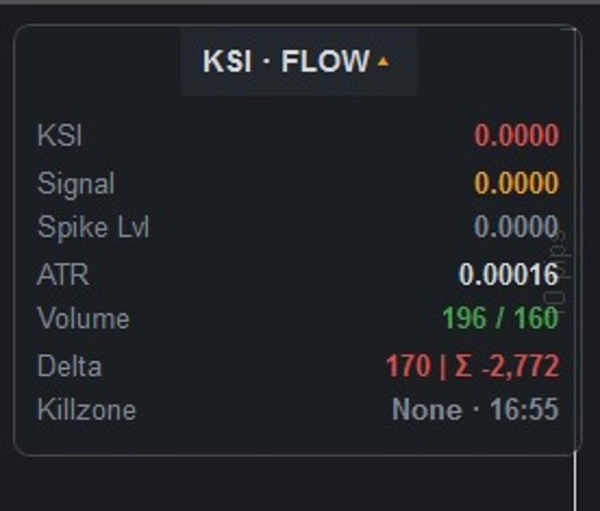
## 📌 Pannello Informazioni Professionale
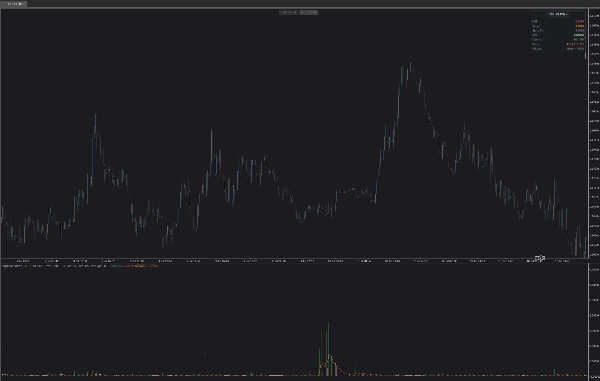
La dashboard integrata fornisce una panoramica chiara direttamente sul tuo grafico:
📍 Valore KSI attuale
📍 Livello del segnale
📍 Soglia adattiva del picco
📍 Lettura della volatilità ATR
📍 Volume attuale vs volume medio
📍 Delta e delta cumulativo
📍 Sessione di trading attiva / killzone
Il pannello può essere:
* ✅ Posizionato in qualsiasi angolo del grafico
* ✅ Compresso o espanso
* ✅ Regolato con opacità personalizzata
## ⚙️ Impostazioni Personalizzabili
Regola finemente il KSI per qualsiasi stile di trading:
🔧 Periodo EMA del volume
🔧 Periodo del segnale
🔧 Fattore di scala
🔧 Rilevamento picchi adattivo o fisso
🔧 Periodo di lookback dei picchi
🔧 Moltiplicatore di sensibilità dei picchi
🔧 Periodo ATR
🔧 Impostazioni dell'aspetto del pannello
## 🎯 Progettato Per
✔ Trader Forex
✔ Trader di Futures
✔ Trader Crypto
✔ Scalper
✔ Trader giornalieri
✔ Analisti della struttura di mercato
✔ Trader in cerca di conferme basate sul volume
## 💡 Come i Trader Usano il KSI
Il KSI può aiutare a identificare:
⚡ Attività di mercato insolita
⚡ Potenziale pressione di breakout
⚡ Divergenza volume-prezzo
⚡ Eventi di liquidità
⚡ Cambiamenti di momentum
⚡ Opportunità di trading ad alta volatilità
Combina il KSI con la tua strategia esistente per ottenere una visione più chiara di **quando il mercato si muove normalmente — e quando sta accadendo qualcosa di insolito.**
📈 Fai trading in modo più intelligente. Comprendi la pressione di mercato. Rileva attività nascoste con l'Indice di Slittamento Cinetico.
Riepilogo
The indicator includes volume and flow analysis by comparing current volume to its exponential moving average (EMA) and incorporates cumulative delta analysis to visualize buying and selling pressure. A smooth signal line and histogram help confirm changes in KSI momentum, making shifts in market pressure easier to interpret.
KSI tracks major trading sessions—Asia, London, and New York (AM, Lunch, PM)—highlighting periods of higher liquidity and volatility. A professional information panel displays key metrics such as current KSI value, signal level, adaptive spike threshold, ATR volatility, volume comparisons, delta values, and active trading sessions. This panel is customizable in position, size, and opacity.
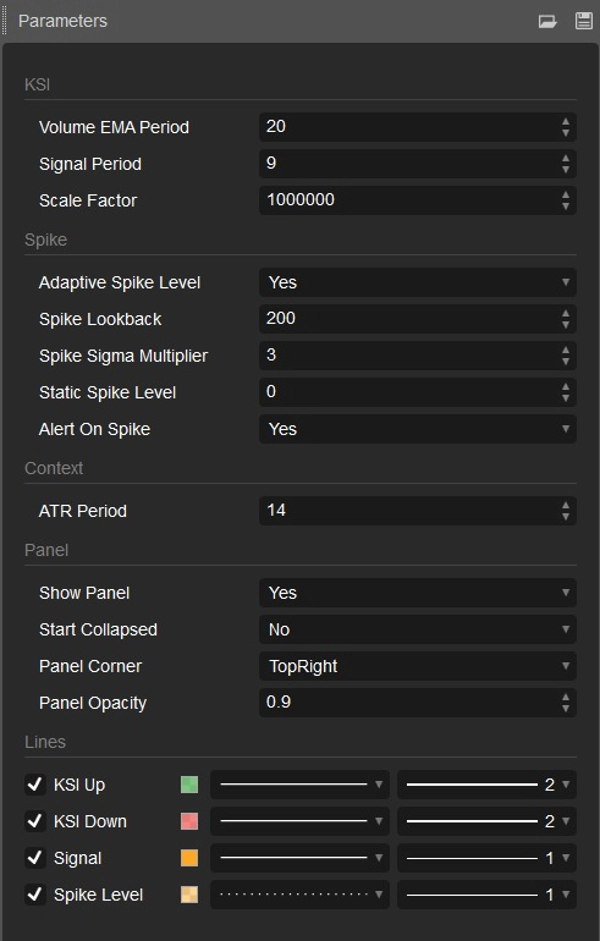
Settings allow fine-tuning of volume EMA period, signal period, scale factor, spike detection parameters, ATR period, and panel appearance. KSI is suitable for forex, futures, and crypto traders, including scalpers, day traders, and market structure analysts seeking volume-based confirmation and insights into unusual market activity, breakout pressure, liquidity events, and momentum changes.
Discussioni
Recensioni dei clienti
5 | 0 % | |
4 | 100 % | |
3 | 0 % | |
2 | 0 % | |
1 | 0 % |
Domande frequenti
Altro da questo autore














![Logo di "[Stellar Strategies] MARSI Signal Plotter"](https://cdn.ctrader.com/image/webp/7b2b8da6-8f8e-4646-8d4a-4710c516c01e_25567)



Prezzo