
คำอธิบาย
## 📊 การแตกของแนวรับ & แนวต้านคืออะไร?
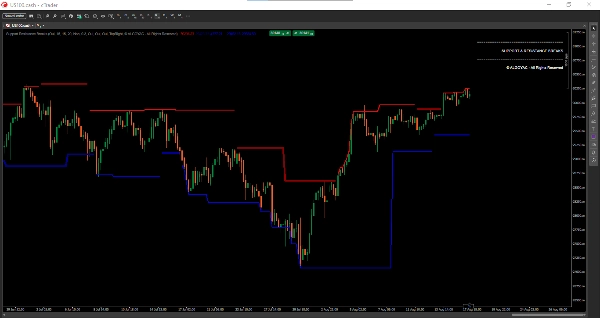
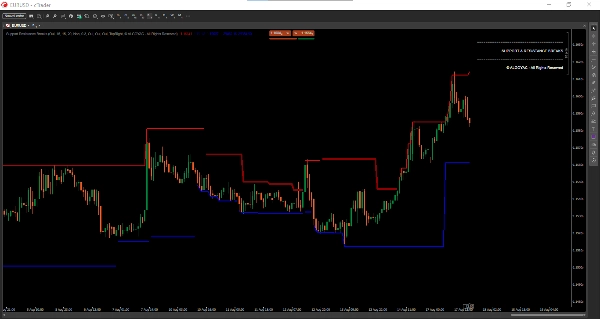
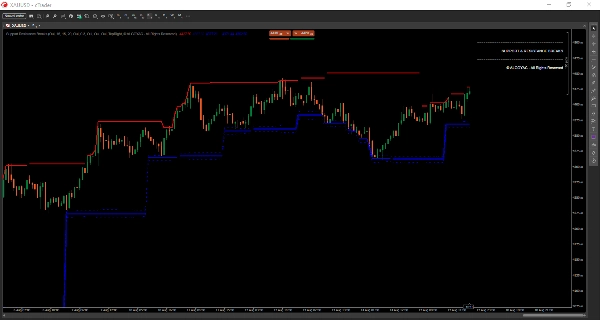
Support & Resistance Breaks เป็นตัวบ่งชี้ระดับมืออาชีพที่ตรวจจับระดับราคาสำคัญแบบเรียลไทม์และแจ้งเตือนผู้เทรดถึงโอกาสการเบรคเอาท์ที่มีความน่าจะเป็นสูง แตกต่างจากตัวบ่งชี้แบบดั้งเดิมที่ล่าช้า เครื่องมือนี้ตรวจจับโซนแนวรับและแนวต้านในขณะที่มันก่อตัวขึ้น ทำให้ผู้เทรดสามารถตอบสนองต่อการเคลื่อนไหวของตลาดได้อย่างรวดเร็ว
ตัวบ่งชี้นี้ผสมผสานการวิเคราะห์จุดหมุนกับการยืนยันปริมาณและระบบการให้คะแนนที่ซับซ้อนเพื่อเน้นเฉพาะระดับที่สำคัญที่สุด
## 🎯 คุณสมบัติหลัก
### 1. การตรวจจับระดับแบบเรียลไทม์
- **ไม่มีความล่าช้า** : ระดับถูกตรวจจับในขณะที่มันก่อตัว ไม่ใช่หลังจากนั้น
- **อัปเดตแบบไดนามิก** : แนวรับและแนวต้านปรับตัวตามสภาพตลาดที่เปลี่ยนแปลง
- **ปรับอัตโนมัติ** : ระดับอัปเดตตามการเคลื่อนไหวของราคา
### 2. การให้คะแนนความแข็งแกร่งของระดับ
แต่ละระดับจะได้รับคะแนนความแข็งแกร่ง (0-100%) ตาม:
- **จำนวนครั้งที่สัมผัส** (40%) : จำนวนครั้งที่ราคาทดสอบระดับนั้น
- **ปริมาณที่ระดับ** (30%) : กิจกรรมการซื้อขายใกล้ระดับ
- **การปฏิเสธแท่งเทียน** (20%) : คุณภาพของการปฏิเสธราคา
- **ความสดของระดับ** (10%) : ระดับถูกก่อตัวขึ้นเมื่อเร็วๆ นี้แค่ไหน
ระดับที่แข็งแกร่ง (>60%) จะแสดงด้วยเส้นที่หนากว่า:
- **สีแดงเข้ม/น้ำเงินเข้ม** : ระดับแข็งแกร่ง (ความน่าจะเป็นสูง)
- **สีแดงอ่อน/น้ำเงินอ่อน** : ระดับมาตรฐาน (ความน่าจะเป็นปานกลาง)
### 3. โซนแนวรับ/แนวต้าน
- **ขนาดโซนที่ปรับได้** : อิงตามตัวคูณ ATR
- **โซนที่มองเห็นได้** : เส้นประแสดงความกว้างเต็มของโซน
- **การแสดงผลที่สมจริง** : โซนสะท้อนพฤติกรรมตลาดจริงได้ดีกว่าเส้นเดียว
### 4. การให้คะแนนคุณภาพของการเบรคเอาท์
สัญญาณเบรคเอาท์แต่ละรายการมีคะแนนคุณภาพ (0-100%) ตาม:
- **การยืนยันปริมาณ** (30%) : ปริมาณเพิ่มขึ้นในช่วงเบรคเอาท์
- **ขนาดแท่งเทียน** (25%) : ความแข็งแกร่งของแท่งเทียนเบรคเอาท์
- **ตำแหน่งปิด** (25%) : ราคาปิดเมื่อเทียบกับช่วงราคา
- **ความแข็งแกร่งของระดับ** (20%) : ความสำคัญของระดับที่ถูกเบรค
**สีคุณภาพ :**
- **สีเขียวมะนาว** : เบรคเอาท์คุณภาพสูง (>70%)
- **สีเหลือง** : คุณภาพปานกลาง (40-70%)
- **สีส้ม** : คุณภาพต่ำ (<40%)
### 5. สัญญาณเบรคเอาท์
- **ป้าย "B"** : เบรคเอาท์พร้อมการยืนยันปริมาณ
- **"Bull Wick"** : การปฏิเสธแนวรับแบบกระทิง
- **"Bear Wick"** : การปฏิเสธแนวต้านแบบหมี
## 📈 วิธีตีความสัญญาณ
### การยืนยันเบรคเอาท์
เบรคเอาท์คุณภาพสูง (ป้าย "B" สีเขียวมะนาว) พร้อมปริมาณที่แข็งแกร่งบ่งชี้ถึงเบรคเอาท์ที่แท้จริง เบรคเอาท์คุณภาพต่ำ (สีส้ม) อาจเป็นสัญญาณเท็จ
### การทดสอบระดับ
เมื่อราคาทดสอบระดับซ้ำๆ (สัมผัสหลายครั้ง) ระดับนั้นจะได้รับความแข็งแกร่ง ระดับที่แข็งแกร่งมีแนวโน้มที่จะยึดมั่นหรือทำให้เกิดการกลับตัวที่สำคัญ
### การเทรดโซน
แทนที่จะเทรดที่ระดับที่แน่นอน ให้ใช้โซน เข้าทำการเทรดใกล้ขอบเขตโซน ไม่ใช่ตรงกลาง
### การวิเคราะห์ปริมาณ
ออสซิลเลเตอร์ปริมาณ (EMA 5 เทียบกับ EMA 10) ช่วยยืนยันความถูกต้องของเบรคเอาท์ เบรคเอาท์ที่มีปริมาณ > เกณฑ์จะน่าเชื่อถือมากขึ้น
## ⚙️ การตั้งค่า & พารามิเตอร์
### กลุ่มจุดหมุน
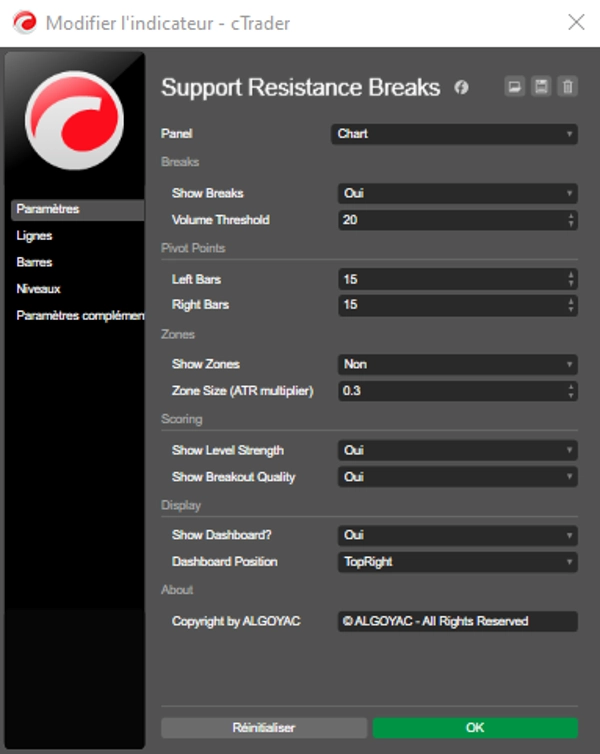
- **แท่งซ้าย** (ค่าเริ่มต้น: 15) : จำนวนแท่งทางซ้ายสำหรับการตรวจจับจุดหมุน
- **แท่งขวา** (ค่าเริ่มต้น: 15) : จำนวนแท่งทางขวาสำหรับการยืนยันจุดหมุน
### กลุ่มการแตก
- **แสดงการแตก** (ค่าเริ่มต้น: true) : แสดงสัญญาณเบรคเอาท์
- **เกณฑ์ปริมาณ** (ค่าเริ่มต้น: 20) : ค่าต่ำสุดของออสซิลเลเตอร์ปริมาณสำหรับการแตกที่ถูกต้อง
### กลุ่มโซน
- **แสดงโซน** (ค่าเริ่มต้น: true) : แสดงโซนแนวรับ/แนวต้าน
- **ขนาดโซน** (ค่าเริ่มต้น: 0.3) : ความกว้างโซนในรูปแบบตัวคูณ ATR
### กลุ่มการให้คะแนน
- **แสดงความแข็งแกร่งของระดับ** (ค่าเริ่มต้น: true) : แสดงระดับแข็งแกร่งกับระดับอ่อน
- **แสดงคุณภาพเบรคเอาท์** (ค่าเริ่มต้น: true) : แสดงคะแนนคุณภาพบนเบรคเอาท์
## 💼 กรณีการใช้งานทั่วไป
### การเทรดรายวัน
- ใช้บนกรอบเวลา M15-H1
- เข้าทำการเทรดบนเบรคเอาท์คุณภาพสูง (ป้ายสีเขียวมะนาว)
- ตั้งจุดหยุดเกินขอบเขตโซน
- ทำกำไรที่ระดับแนวรับ/แนวต้านถัดไป
### การเทรดสวิง
- ใช้บนกรอบเวลา H4-D1
- เน้นระดับแข็งแกร่ง (>60% ความแข็งแกร่ง)
- รอให้ราคามาถึงโซนก่อนเข้าทำการเทรด
- ใช้คุณภาพเบรคเอาท์เพื่อยืนยัน
### การสแคปปิ้ง
- ใช้บนกรอบเวลา M1-M5
- เทรดการดีดตัวจากระดับแข็งแกร่ง
- เข้าทำการเทรดและออกอย่างรวดเร็วที่ขอบเขตโซน
- การยืนยันด้วยปริมาณเป็นสิ่งจำเป็น
## 👥 ตัวบ่งชี้นี้เหมาะกับใคร?
### เหมาะสำหรับ:
- **ผู้เทรดระดับ** : ระบุและเทรดระดับสำคัญ
- **ผู้เทรดเบรคเอาท์** : จับเบรคเอาท์แท้จริงพร้อมการยืนยันคุณภาพ
- **ผู้เทรดในช่วงแนวรับ/แนวต้าน** : เทรดระหว่างโซนแนวรับและแนวต้าน
- **ผู้เทรดปริมาณ** : ใช้วิเคราะห์ปริมาณเพื่อยืนยัน
### ระดับประสบการณ์:
- **ผู้เริ่มต้น** : ระดับและสัญญาณที่มองเห็นชัดเจน
- **ระดับกลาง** : ใช้การให้คะแนนเพื่อการเข้าที่ดีขึ้น
- **ขั้นสูง** : ผสมผสานกับการวิเคราะห์หลายกรอบเวลา
## ⚠️ หมายเหตุสำคัญ & ข้อจำกัด
1. **เบรคเอาท์เท็จ** : ไม่ใช่เบรคเอาท์ทุกครั้งที่จะสำเร็จ ใช้คะแนนคุณภาพและการยืนยันปริมาณ
2. **ระดับซ้ำซ้อน** : มีระดับมากเกินไปในตลาดที่ผันผวน ปรับแท่งซ้าย/ขวาตามความเหมาะสม
3. **ความกว้างโซน** : โซนอาจกว้างในตลาดที่มี ATR สูง ปรับพารามิเตอร์ขนาดโซน
4. **ไม่ใช่เครื่องมือเดี่ยว** : ใช้ร่วมกับตัวบ่งชี้อื่นๆ (โมเมนตัม, การวิเคราะห์แนวโน้ม) จะดีที่สุด
5. **สภาพตลาด** : ทำงานได้ดีที่สุดในตลาดที่มีแนวโน้ม ตลาดที่เคลื่อนไหวในช่วงอาจให้สัญญาณเท็จมากมาย
## 🔧 การตั้งค่าที่แนะนำ
| ประเภทตลาด | แท่งซ้าย | แท่งขวา | ขนาดโซน |
|-------------|-----------|------------|-----------|
| Forex | 15 | 15 | 0.3 |
| หุ้น | 20 | 10 | 0.2 |
| Crypto | 25 | 15 | 0.5 |
| ดัชนี | 15 | 10 | 0.3 |
## 🚀 เริ่มต้นใช้งาน
1. เพิ่มตัวบ่งชี้ลงในกราฟของคุณ
2. สังเกตระดับเริ่มต้นและความแข็งแกร่งของพวกมัน
3. รอให้ราคามาใกล้ระดับแข็งแกร่ง
4. ดูสัญญาณเบรคเอาท์พร้อมคะแนนคุณภาพ
5. เข้าทำการเทรดบนเบรคเอาท์คุณภาพสูง (>70%)
6. ใช้โซนสำหรับการตั้งจุดหยุดขาดทุน
---
สรุป
The indicator displays configurable support and resistance zones using ATR multipliers, providing a realistic market representation beyond single lines. Breakout signals include quality scores derived from volume surges, candle body size, close position, and level strength, with color-coded quality indicators (lime for high, yellow for moderate, orange for low).
Breakout signals are labeled ("B" for volume-confirmed breakouts, "Bull Wick" for bullish rejections, and "Bear Wick" for bearish rejections). Volume oscillators assist in confirming breakout validity. Settings allow customization of pivot detection bars, zone size, and display options.
Suitable for various trading styles—including day trading, swing trading, and scalping—this indicator supports multiple timeframes and markets such as Forex, stocks, crypto, and indices. It is intended for traders of all experience levels seeking to identify and trade key levels, breakouts, and ranges with volume-based confirmation.
รีวิวจากลูกค้า
5 | 50 % | |
4 | 50 % | |
3 | 0 % | |
2 | 0 % | |
1 | 0 % |














!["[CB] Pivot Points Pro" โลโก้](https://cdn.ctrader.com/image/webp/43463c82-67b0-4f10-a4ba-901bba091d81_32594)