present
Daftar dan dapatkan diskon $50 untuk pembelian pertama Anda
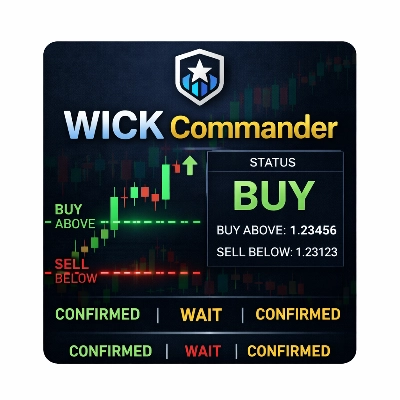
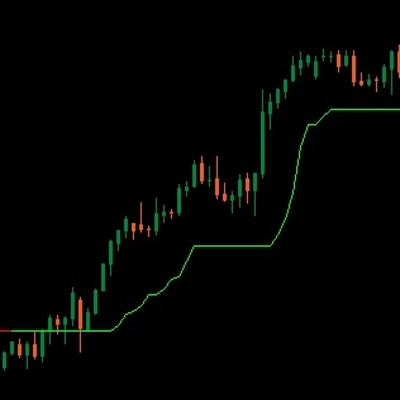
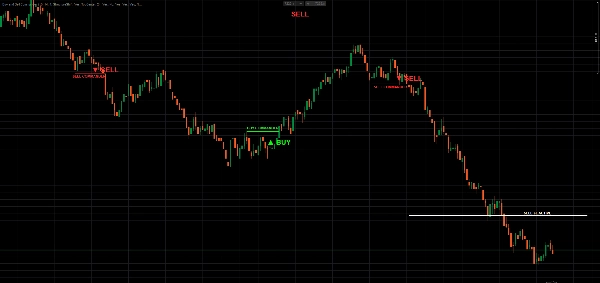
Trading product for Buy and Sell Commander Indikator Aggressive Supertrend, image 1
Buy and Sell Commander
Indikator
Versi 1.0, May 2026
Windows, Mac
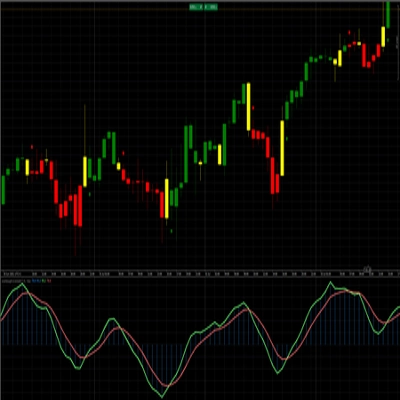
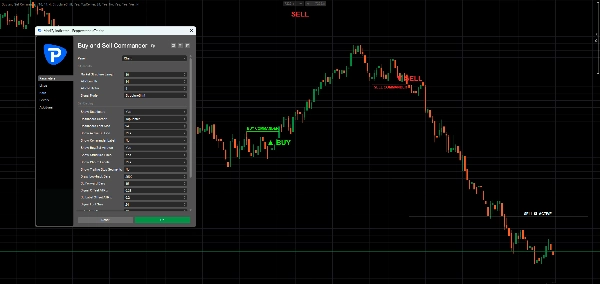
Trading product for Buy and Sell Commander Indikator Aggressive Supertrend, image 2
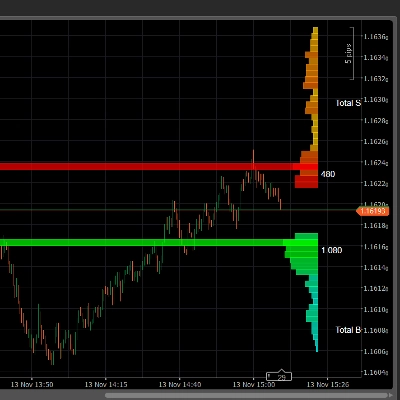
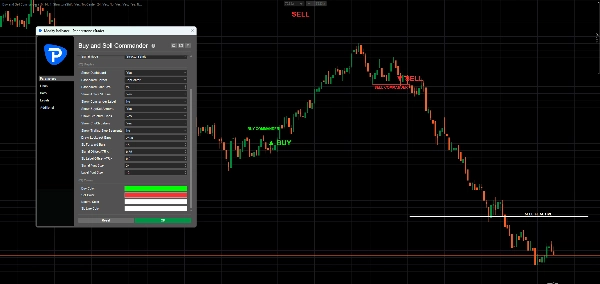
Trading product for Buy and Sell Commander Indikator Aggressive Supertrend, image 3
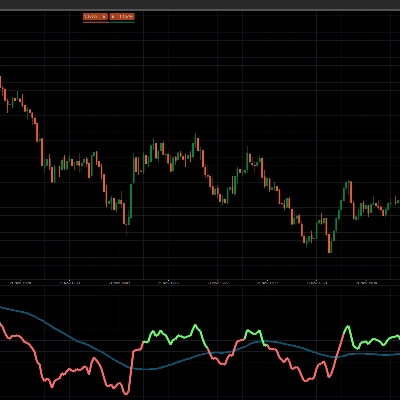
Trading product for Buy and Sell Commander Indikator Aggressive Supertrend, image 4
86
Penjualan
1.18K
Instal gratis

Deskripsi

BUY & SELL Commander is designed to help traders quickly understand the current market direction without overcomplicating the chart.

The indicator displays a simple dashboard at the top of the chart showing the active market status:

BUY
SELL
or
NEUTRAL

It also plots clear BUY and SELL signals directly on the chart and uses a white Active SL Line as a dynamic trend-flip level.

The goal of this indicator is simple:

to help traders see when buyers or sellers are currently in control.


How It Works

The indicator uses market structure and an ATR-based active stop line to determine the current trading direction.

In simple terms:

  • When the market is bullish, the dashboard shows BUY.
  • When the market is bearish, the dashboard shows SELL.
  • Before a valid signal appears, the dashboard shows NEUTRAL.

The white Active SL Line is the key part of the indicator.

When BUY is active, the white line normally follows below price.
When SELL is active, the white line normally follows above price.


Close Cross Active SL Mode

In CloseCrossActiveSL mode, the logic is very easy to understand.

When the indicator is in SELL mode, price must close above the white SELL SL ACTIVE line to trigger a new BUY signal.

When the indicator is in BUY mode, price must close below the white BUY SL ACTIVE line to trigger a new SELL signal.

So the basic logic is:

SELL active + candle closes above the Active SL Line = BUY signal

BUY active + candle closes below the Active SL Line = SELL signal

The indicator uses candle close confirmation, not only wick movement. This helps reduce false flips caused by temporary spikes.


What the Indicator Shows

Dashboard

A simple dashboard displays the current status:

  • BUY
  • SELL
  • NEUTRAL

This makes it easy to see the current direction at a glance.

BUY and SELL Signals

The indicator marks direction changes on the chart with clear signals:

  • ▲ BUY
  • ▼ SELL

Active SL Line

The white Active SL Line works as a dynamic trend-following stop line.

In BUY mode, the line follows below price.
In SELL mode, the line follows above price.

When price closes through this line, the market direction can change.


Main Features

  • Simple BUY / SELL / NEUTRAL dashboard
  • Clear BUY and SELL chart signals
  • ATR-based Active SL Line
  • Candle close confirmation
  • Market structure based signal detection
  • Optional CloseCrossActiveSL mode
  • Adjustable ATR settings
  • Adjustable dashboard position
  • Clean overlay display
  • Suitable for multiple timeframes and symbols


Recommended Use

BUY & SELL Commander can be used as:

  • a trend direction filter
  • a visual trailing stop guide
  • a trade confirmation tool
  • a market bias dashboard
  • a simple BUY / SELL decision support indicator

Example usage:

If the dashboard shows BUY, traders may focus mainly on buy opportunities.
If the dashboard shows SELL, traders may focus mainly on sell opportunities.
If the dashboard shows NEUTRAL, traders may wait for a valid signal.


Main Settings

Market Structure Length

Controls how sensitive the indicator is to market swings.

Lower values create faster signals.
Higher values create smoother and slower signals.

ATR Length

Controls the ATR calculation period.

ATR Multiplier

Controls the distance of the Active SL Line from price.

Lower values make the line tighter and more sensitive.
Higher values make the line wider and smoother.

Signal Mode

Choose between:

StructureShift
Uses market structure breaks to detect direction changes.

CloseCrossActiveSL
Uses candle close crosses of the Active SL Line to detect direction changes.

Dashboard Position

Choose where the BUY / SELL / NEUTRAL dashboard appears on the chart.


Simple Trading Logic

The indicator is built around one simple idea:

Trade with the active direction until price closes through the Active SL Line.

When BUY is active, the market bias remains bullish until price closes below the Active SL Line.

When SELL is active, the market bias remains bearish until price closes above the Active SL Line.


Important Note

This indicator does not guarantee profitable trades and should not be used as a standalone trading system. It is designed as a visual decision-support tool. Always combine it with your own strategy, risk management, and market analysis.


Disclaimer

Trading forex, indices, commodities, and other financial markets involves risk. Past performance does not guarantee future results. Use this indicator for analysis and educational purposes only.

Ringkasan

Profil indikator
Kategori indikator
Tren
Tipe output
Sinyal
Persyaratan data
Hanya batang
Data tick
Sinyal yang didukung
Cross
Breakout
Reversal
Level tertembus

Diskusi

Ulasan pelanggan

0.0
Ulasan: 0
Ulasan pelanggan
Belum ada ulasan untuk produk ini. Sudah mencobanya? Jadilah pemberi ulasan pertama!

Pertanyaan umum

Aggressive
Supertrend
Produk-produk yang tersedia melalui cTrader Store, termasuk bot trading, indikator, dan plugin, disediakan oleh pengembang pihak ketiga serta hanya ditujukan untuk akses teknis dan informasi. cTrader Store bukan broker dan tidak menyediakan saran investasi, rekomendasi pribadi, atau jaminan apa pun tentang kinerja di masa mendatang.

Produk lain dari penulis ini

Indikator
AI
ATR
+27
SR Commander is a clean and intelligent support and resistance indicator for cTrader, built to help traders identify key
Indikator
AI
ATR
+20
Buy and Sell Signals
Indikator
AI
ATR
+27
WICK COMMANDER — Know Exactly When the Market Commits
Indikator
AI
ATR
+27
Overbought Oversold Indicator
Indikator
AI
ATR
+20
Know Sure Thing (KST) momentum engine
Indikator
AI
SMC
+5
Coloring trendline/ Colored Trendline / Color Trendline
Indikator
AI
ATR
+27
VWAP Sniper Elite -- Institutional Trend Engine
Indikator
AI
SMC
+13
Dynamic Liquidity Depth exposes hidden volume
Indikator
AI
ATR
+26
Entry Momentum MACD Power Guide
Indikator
AI
ATR
+27
The Professional “All-in-One” Trading Suite (buy and sell indicator)
Indikator
AI
ATR
+26
SR Commander — Multi Timeframe Edition. See where the big money draws the line. Trade on your timeframe. Think on theirs
Logo "crossover 1"
Peringkat teratas
4.2
(5)
$19
/
$29
Indikator
AI
Grid
+10
Crossover Buy and Sell Alerts and signals

Anda mungkin juga suka

Logo "TrendMagicOptimized"
Peringkat teratas
4.5
(4)
$19
/
$20
Indikator
Clean trend indicator using CCI & ATR. Highlights up/down trends with adaptive, no-repaint lines.
Logo "ADT_bigCandles"
Peringkat teratas
4.7
(4)
$20
/
$40
Indikator
ATR
Prop
Outside Candle Detector: Highlights major candles/zones with ATR filter & pattern labels. By Avydel Talbo, prop trader.
Indikator
Forex
Crypto
+3
Consecutive Series Moves — Reveal the True Pulse of Price Action
Indikator
RSI
BTCUSD
+5
Traders Dynamic Index (TDI) — Divergence Edition
Indikator
ATR
RSI
+4
Adaptive Ichimoku with nine-factor confluence scoring, five signal types, smart TP/SL and an MTF panel.
Indikator
Spread Filter
SpreadSync Entry Timer is a compact cTrader indicator that shows live spread and candle-close.
Indikator
VWAP
Volume
+5
Multi VWAP. Three timeframes. One clean chart. Your Essential Trading Tool.
Indikator
This indicator is a valuable tool for traders looking to identify significant opening price level of any asset.
Indikator
Prop
Crypto
+5
VIX Pro: Confirm Real Breakouts & Filter Market Noise with Volatility
Indikator
Forex
Real-Time Candlestick Pattern Detection with Custom Alerts & Trend Analysis for cTrader
Indikator
ADX
ATR
+5
Signal Quality Score - 0-100 filter combining RSI, Volume, ATR, Trend Strength & Alignment. Works on ANY chart type.
Indikator
ATR
Wedge
+2
Strong Supertrend Turn Market Movement into a Clear Map Market analysis
Indikator
ATR
EMA
+4
The FULL-MARKET-VIEW-DASHBOARD is a professional-grade trading suite for cTrader that eliminates market noise.
Indikator
AI
RSI
+18
Session boxes with UTC offset, OR logic, adjustable opacity, and multi-day lookback.
Indikator
ATR
BOS
+5
Market structure with BOS and CHoCH, order blocks, and retest buy/sell arrows with entry, stop and two targets
Indikator
Key Levels
Liquidity Grab
+2
The levels you mark each morning, drawn and followed: PDH/PDL, weekly, monthly, sessions, equal highs/lows.
Indikator
EMA
RSI
+4
🚀📈 Plot buy/sell signals on Range Bars using Moving Averages and RSI. Clear, actionable trading insights.🚀📈
Indikator
EMA
Supertrend
+4
Dynamic dual MA cloud indicator. Identifies trends, crossovers, and pullback entries in real time for any asset.

Harga

86
Penjualan
1.18K
Instal gratis