설명
가격 예측 다이내믹 📈🔮
https://chartshots.spotware.com/c/69d5304ea1cc1
이것은 무엇인가요?
https://chartshots.spotware.com/c/69d52fb4b01cd
가격 예측 다이내믹은 몬테카를로 시뮬레이션을 사용하여 통계적으로 가능한 미래 가격 경로를 예측하고 베이지안 확률 분류기를 통해 방향성 편향을 평가하는 오버레이 지표입니다. 이 지표는 한 가지 질문에 답합니다: 이 자산이 어떻게 움직여 왔는지를 고려할 때, 다음에 통계적으로 어디로 갈 가능성이 높은가요? 📊
https://chartshots.spotware.com/c/69d53010d38ce
작동 원리 ⚙️
엔진 1 — 몬테카를로 예측 🎲
이 지표는 최근 가격 이력을 분석하고 로그 수익률을 추출합니다. 평균 수익률과 표준 편차를 계산하여 자산의 추세(경향)와 변동성(불규칙한 움직임) 🌪️을 포착합니다.
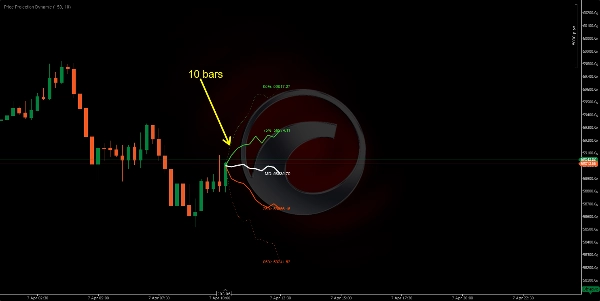
최대 500개까지 200개의 시뮬레이션된 가격 경로를 미래로 실행합니다. 각 시뮬레이션은 실제 최근 움직임을 기반으로 한 "랜덤 워크"입니다. 이들 중에서 지표는 5개의 백분위 밴드를 추출합니다:
밴드
의미
95%
낙관적인 극단 — 시뮬레이션 중 5%만이 더 높게 갔음 🚀
75%
상위 가능한 범위 — 가격이 이 밴드 위에서 종료된 경우가 25% 📈
50% (MD)
중앙 예측 — 모든 결과의 통계적 중심 🎯
25%
하위 가능한 범위 — 가격이 이 밴드 아래에서 종료된 경우가 25% 📉
05%
비관적인 극단 — 시뮬레이션 중 5%만이 더 낮게 갔음 📉🛑
전문가 팁: 팬이 넓게 펼쳐질수록 현재 변동성이 높다는 의미입니다 📢. 팬이 좁으면 자산이 예측 가능하게 움직이고 있다는 뜻입니다 🧵.
엔진 2 — 베이지안 분류기 🧠
예측과 독립적으로, 이 엔진은 시장을 강세 또는 약세로 분류합니다:
- 기본값 500개 바를 기준으로 과거를 살펴봅니다 🔍.
- 강세와 약세 바에 대한 상대 거래량과 모멘텀을 측정합니다.
- 가우시안 확률을 사용하여 현재 바가 어느 프로필에 더 잘 맞는지 계산합니다 ⚖️.
결과는 승리 확률 백분율입니다:
확률
해석
> 70%
높은 강세 신뢰도 ✅🟢
50–70%
중간 / 불확실 ⚖️🟡
< 30%
높은 약세 신뢰도 ✅🔴
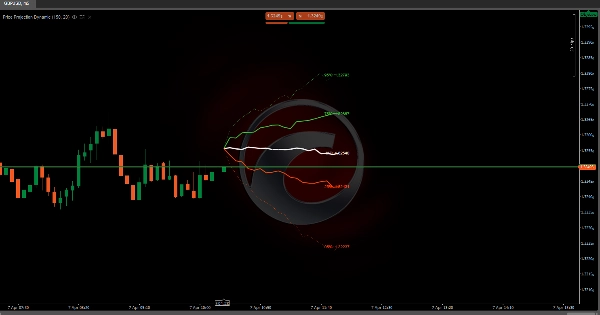
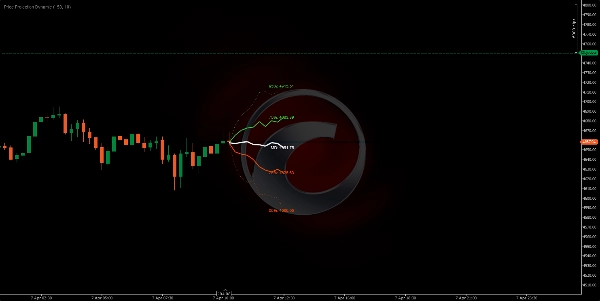
시각적 요소 🎨
- 녹색 선 (75%, 95%): 상위 예측 밴드 — 강세 범위 🍏
- 흰색 선 (MD): 중앙 예측 가격 — 가장 가능성 높은 경로 🏁
- 주황색 선 (25%, 05%): 하위 예측 밴드 — 약세 범위 🍊
- 점선 외곽선: 95% 및 05% 극단 (낮은 확률 경계) ⚠️
- 실선 내부선: 75%, 50%, 25% (높은 확률 구역) ✅
- 가격 라벨: 각 백분위수에 대한 정확한 예측 가격 🏷️
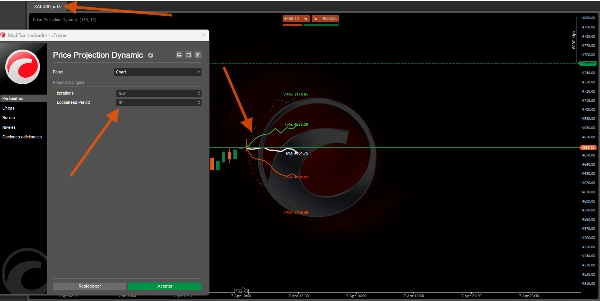
- 정보 패널 (우측 상단): 베이지안 승리 확률, 중앙 목표, 상대 거래량, 신호 방향 🖥️
사용 방법 📖
- 팬 모양을 읽으세요 📢 — 팬이 빠르게 확장되면 변동성이 높고 예측이 덜 확실합니다.
- 중앙선 (MD)을 사용하세요 🎯 가장 통계적으로 가능한 미래 가격 목표로.
- 75%/25% 밴드를 사용하세요 📏 거래를 위한 현실적인 상/하위 목표로.
- 95%/05% 밴드를 사용하세요 🛑 극단 경계로 — 손절매 설정에 유용합니다.
- 베이지안 패널을 확인하세요 🧠 — 70% 이상 또는 30% 이하의 확률은 방향성 확신을 더합니다.
- 두 엔진을 결합하세요 🤝 — 중앙선이 상승 경사이고 그리고 베이지안 확률이 70% 이상이면, 설정이 통계적으로 강력합니다.
주요 매개변수 ⚙️
매개변수
제어 대상
높은 값
낮은 값
반복 횟수
시뮬레이션된 경로 수
더 부드러운 밴드 🌊
더 빠른 계산 ⚡
미리보기
미래 예측 거리
더 긴 전망 🔭
더 짧고 신뢰할 수 있음 🔍
샘플 깊이
분석할 최근 바
장기 행동 🐢
최근 행동만 🐇
분류기 창
베이지안 이력
더 안정적인 확률 ⚖️
더 반응성이 높음 ⚡
지표 프로필 📋
- 지표 카테고리: 통계 📊
- 출력 유형: 시각화 및 신호 🖼️
- 데이터 요구사항: 바만 📶
면책 조항 ⚠️
이 지표는 통계적 확률을 예측하며, 예측 자체는 아닙니다 🔮. 몬테카를로 시뮬레이션은 미래가 최근 과거와 비슷할 것이라고 가정하지만, 이는 블랙 스완 이벤트 🦢나 뉴스로 인한 갭에서는 깨질 수 있습니다. 자신의 위험 관리와 함께 확률적 프레임워크로 사용하세요 🛡️.
요약
Separately, the Bayesian classifier evaluates market sentiment by analyzing relative volume and momentum over a configurable window, providing a win probability percentage that indicates bullish or bearish confidence. Visual elements include color-coded projection bands (green for bullish, orange for bearish), a median price line, price labels for each percentile, and an info panel displaying Bayesian probability and other metrics.
Key adjustable parameters include the number of simulation iterations, projection horizon, sample depth of historical bars, and classifier window size. The indicator requires bar data with volume and outputs visual projections and directional signals. It is designed to offer a probabilistic framework for anticipating price movement based on recent market behavior, suitable for various symbols including BTCUSD, EURUSD, GBPUSD, XAUUSD, NAS100, and others.
고객 리뷰
5 | 0 % | |
4 | 100 % | |
3 | 0 % | |
2 | 0 % | |
1 | 0 % |