present
Registrati e ricevi uno sconto da $50 sul tuo primo acquisto
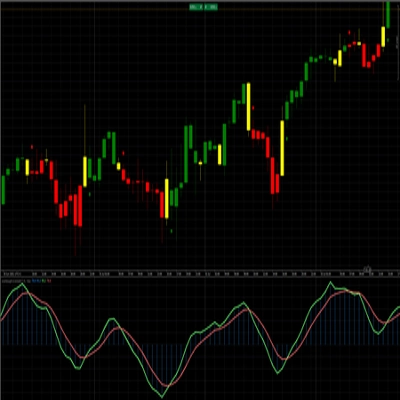
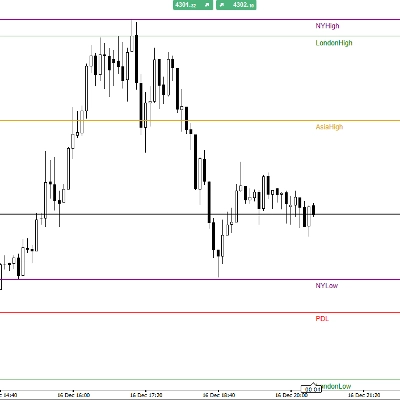
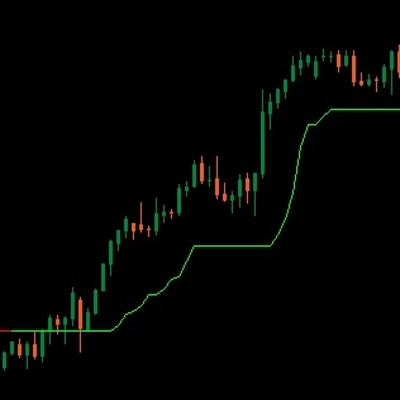
Trading product for Royal liquidity X Indicatore Supertrend Liquidity Sweep, image 1
Royal liquidity X
Indicatore
Versione 1.0, May 2026
Windows, Mac
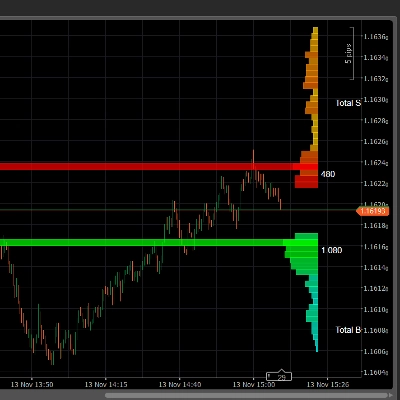
Trading product for Royal liquidity X Indicatore Supertrend Liquidity Sweep, image 2
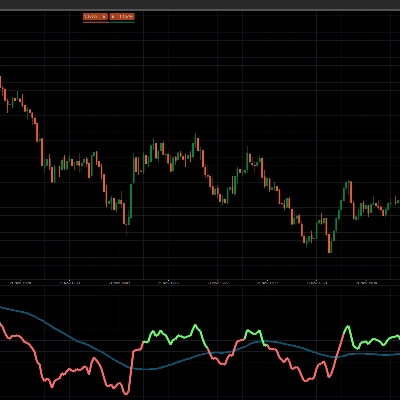
Trading product for Royal liquidity X Indicatore Supertrend Liquidity Sweep, image 3
86
Vendite
1.18K
Installazioni gratuite

Descrizione

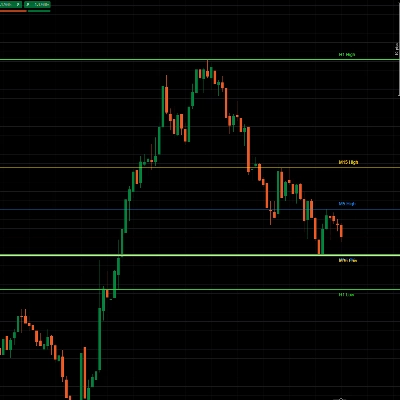
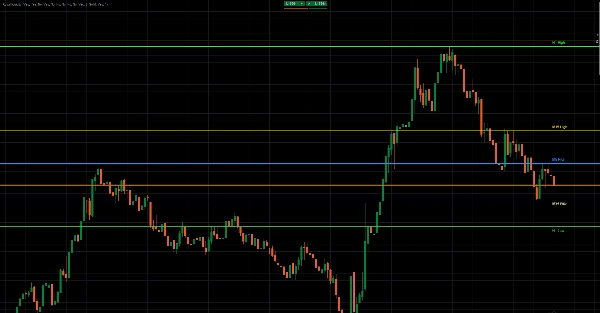
Royal Liquidity X is a clean and powerful multi-timeframe liquidity level indicator designed to display the previous high and previous low from multiple key timeframes directly on the chart.

The indicator helps traders quickly identify important liquidity zones where price may react, sweep liquidity, reject, break out, or continue with momentum. By plotting previous highs and lows from timeframes such as M5, M15, M30, H1, H2, H3, H4, H8, H12, and D1, Royal Liquidity gives traders a clear overview of the most relevant intraday and higher-timeframe liquidity levels.

These previous highs and lows are often watched by traders because they can act as potential stop-loss zones, breakout areas, reversal points, or price magnets. Royal Liquidity makes these levels visible automatically, without the need to manually draw them every session.

How It Works

Royal Liquidity reads the most recently closed candle from each selected timeframe. For every enabled timeframe, it takes the previous candle’s high and low and plots them as horizontal levels on the active chart.

For example:

M15 High = High of the last closed M15 candle
M15 Low = Low of the last closed M15 candle
H1 High = High of the last closed H1 candle
H1 Low = Low of the last closed H1 candle
D1 High = High of the last closed daily candle
D1 Low = Low of the last closed daily candle

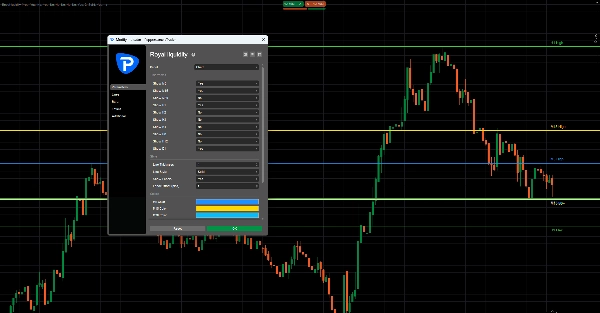
The indicator updates only on the latest chart bar, keeping the chart efficient and lightweight. Each timeframe can be turned on or off individually, and every level can have its own custom color. Traders can also adjust line thickness, line style, labels, and label offset.

What It Shows

Royal Liquidity can display:

Previous M5 High / Low
Previous M15 High / Low
Previous M30 High / Low
Previous H1 High / Low
Previous H2 High / Low
Previous H3 High / Low
Previous H4 High / Low
Previous H8 High / Low
Previous H12 High / Low
Previous D1 High / Low

Each level is drawn as a horizontal line, with optional labels such as M15 High, M15 Low, H1 High, H1 Low, and D1 High / Low.

Trading Use Cases

Royal Liquidity can help traders identify:

Liquidity sweeps
Price may move above a previous high or below a previous low to collect liquidity before reversing.

Breakout zones
A strong break above a previous high or below a previous low can signal continuation or momentum.

Reversal areas
Previous highs and lows can act as important reaction zones where price may reject.

Intraday targets
Higher-timeframe highs and lows can be used as potential target zones.

Market structure context
The indicator helps traders see where price is trading relative to important previous candle levels.

Short Marketplace-Style Version

Royal Liquidity is a multi-timeframe previous high and low indicator built to reveal key liquidity levels directly on your chart. It automatically plots the previous highs and lows from selected timeframes, including M5, M15, M30, H1, H4, H12, and D1.

Designed for liquidity-based traders, breakout traders, scalpers, and intraday traders, Royal Liquidity helps identify potential sweep zones, breakout areas, reversal levels, and profit targets with a clean visual layout.

Disclaimer

Royal Liquidity is a technical analysis tool and does not guarantee profitable trades. It should be used together with risk management, market structure analysis, and a complete trading plan.

Riepilogo

Profilo indicatore
Categoria indicatore
Trend
Tipo di output
Segnali
Requisiti per i dati
Dati sui tick
Segnali supportati
Rottura
Superamento
Livello rotto
Inversione

Discussioni

Recensioni dei clienti

0.0
Recensioni: 0
Recensioni dei clienti
Questo prodotto non ha ancora ricevuto recensioni. L'hai già provato? Fallo sapere agli altri per primo!

Domande frequenti

Supertrend
Liquidity Sweep
Liquidity Grab
I prodotti disponibili tramite cTrader Store, inclusi bot di trading, indicatori e plugin, sono forniti da sviluppatori terzi e resi disponibili esclusivamente a scopo informativo e di accesso tecnico. cTrader Store non è un broker e non fornisce consulenze in materia di investimento, raccomandazioni individualizzate o garanzie di risultati futuri.

Altro da questo autore

Indicatore
AI
ATR
+27
SR Commander is a clean and intelligent support and resistance indicator for cTrader, built to help traders identify key
Indicatore
AI
ATR
+20
Buy and Sell Signals
Indicatore
AI
ATR
+27
WICK COMMANDER — Know Exactly When the Market Commits
Indicatore
AI
ATR
+27
Overbought Oversold Indicator
Indicatore
AI
ATR
+20
Know Sure Thing (KST) momentum engine
Indicatore
AI
SMC
+5
Coloring trendline/ Colored Trendline / Color Trendline
Indicatore
AI
ATR
+27
VWAP Sniper Elite -- Institutional Trend Engine
Indicatore
AI
SMC
+13
Dynamic Liquidity Depth exposes hidden volume
Indicatore
AI
ATR
+26
Entry Momentum MACD Power Guide
Indicatore
AI
ATR
+27
The Professional “All-in-One” Trading Suite (buy and sell indicator)
Indicatore
AI
ATR
+26
SR Commander — Multi Timeframe Edition. See where the big money draws the line. Trade on your timeframe. Think on theirs
Logo di "crossover 1"
Più votato
4.2
(5)
$19
/
$29
Indicatore
AI
Grid
+10
Crossover Buy and Sell Alerts and signals

Potrebbe interessarti anche

Indicatore
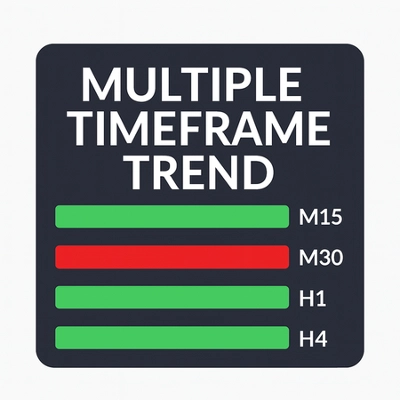
A compact, visual multi-timeframe trend indicator for cTrader. Easily spot bullish or bearish trends across 4 customizab
Indicatore
ADX
ATR
+2
GOLD SENTINEL v1.0 - A CANDLE-COLORING INDICATOR FOR GOLD.
Indicatore
SMC
Prop
+9
PDL/PDH/PWL/PWH and Session higs/lows (customizable)
Indicatore
This indicator is a valuable tool for traders looking to identify significant opening price level of any asset.
Indicatore
ATR
BTCUSD
+5
Trailing algo 📈 auto-tracks trends 🎯 adapts to volatility 🌟 precise moves 🛡️ retest signals 🚀 no lag, smart market
Indicatore
Breakout
Allow trader to visualize Support & Resistance across different timeframes,give trader an overview of the current market
Indicatore
Clean trend indicator using CCI & ATR. Highlights up/down trends with adaptive, no-repaint lines.
Indicatore
ATR
EMA
+5
Candle timer with live profit tracking on chart – displays pips, currency value, and percentage in real time.
Indicatore
MACD
Key Levels
+2
Trend indicator with multi-timeframe filters, generating signals only on fully completed bricks & candles. No Repaint.
Indicatore
AI
ATR
+26
MacD Custom Indicator-Multiple Time Frame
Indicatore
Prop
Forex
+5
🎯 Order Block Detector - Smart Trading: Identifica bloques de órdenes clave en cTrader para un trading más inteligente.
Indicatore
Doji
Volume
+5
Instantly spot high-liquidity institutional moves with clean, non-obtrusive triangle alerts on cTrader charts.
Indicatore
Signal
Trades Opening Range Breakouts Indicator with dynamic stops/targets adapting to market volatility.
Indicatore
VWAP
Support & Resistance
Trading.FC$_vwap Algo shows VWAP trends, dynamic support/resistance and deviation bands to spot potential trade entries.
Indicatore
ATR
BOS
+5
Opening ranges, dynamic trend channels, and multi-scale breakout/retest analysis for clear intraday chart decisions.
Indicatore
Prop
Forex
+4
Displays real-time balance, equity, P&L, margin metrics directly on your charts.
Indicatore
EMA
RSI
+4
🚀📈 Plot buy/sell signals on Range Bars using Moving Averages and RSI. Clear, actionable trading insights.🚀📈
Indicatore
ADX
ATR
+5
10 Factors. One Signal. Zero Guesswork.

Prezzo

86
Vendite
1.18K
Installazioni gratuite