
Açıklama
Ürünümüz, size kapsamlı bir piyasa perspektifi sunmak için bir dizi ana göstergeyi entegre eder:
- Range Box Fibonacci (kendi tasarımımız): Fibonacci seviyelerine dayalı potansiyel destek ve direnç bölgelerini belirlemenize yardımcı olan benzersiz bir araç.
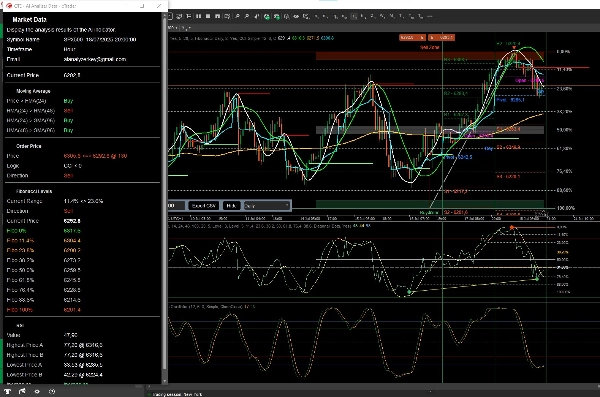
- Ana Referans Fiyatları: Üç özelleştirilebilir göstergenin (CCI, Stokastik, RSI) birleşiminden kritik fiyat noktalarını belirliyoruz. Bu noktalar, giriş ve çıkış fırsatlarını tanımlamanıza rehberlik edecektir.
- Üç Yapılandırılabilir Hareketli Ortalama: Trendleri onaylamak ve fiyat yönündeki değişiklikleri tespit etmek için stratejinize en uygun hareketli ortalamaları seçin.
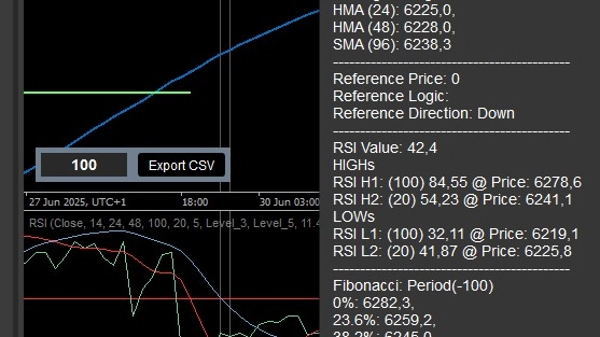
- RSI: Daha doğru fiyat hareketi tahminleri için. Seçilen dönemler için yüksek ve düşük değerlerle. Görselleştirmeye dahil edilmemiştir.
AI Quantum Trading Edge bu göstergelerden veri toplar ve işler, size iki görselleştirme yöntemi sunar:
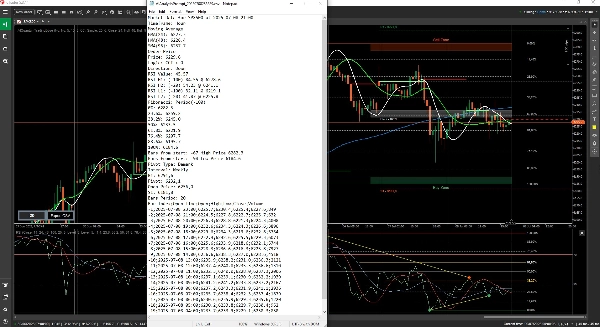
- Manuel Mod: Her gösterge yapılandırmasına göre fiyatın yukarı mı yoksa aşağı mı yöneldiğini özetleyen net ve öz bir pencere.
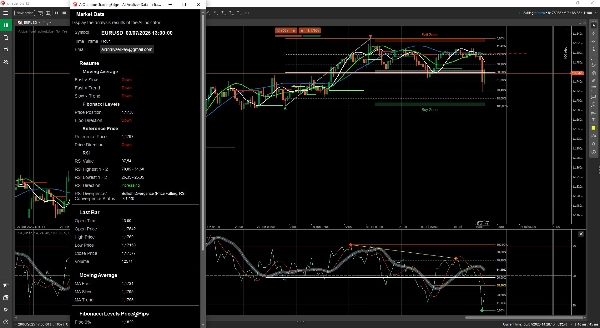
- cTrader Eklentisi: Aynı bilgileri görsel ve erişilebilir şekilde cTrader platformunuza sorunsuz entegrasyon.
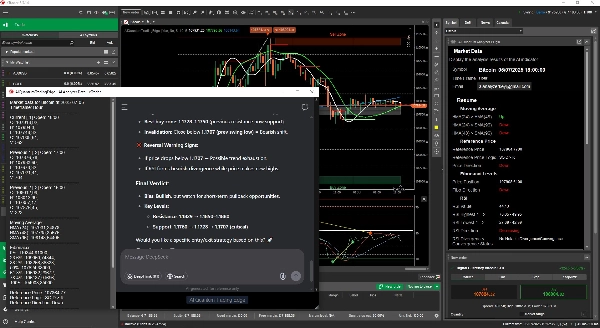
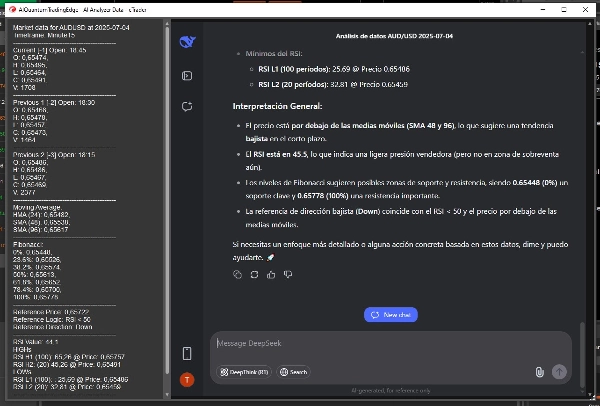
Ayrıca, günümüz ticaret dünyasında insan-makine iletişiminin önemini anlıyoruz. Bu yüzden AI Quantum Trading Edge tüm analiz edilen verilerle bir metin istemi oluşturur. Bu istem, hem insan tacirler hem de AI ajanları tarafından anlaşılacak şekilde tasarlanmıştır ve piyasa analizi için ortak bir dil yaratır. Son olarak, bir AI ajanı bu verileri doğrudan analiz ederek size ek içgörüler sağlayabilir.
AI Quantum Trading Edge ile daha bilinçli ve stratejik ticaret kararları vermek için ihtiyacınız olan bilgileri elde edeceksiniz.
Güncelleme:
Excel'e (CSV) dışa aktarma özelliği
Performans iyileştirmesi
Eklenen Pivot Noktası: Günlük, Haftalık, Aylık
Dışa aktarılan dosyayı bulmak için C:\Users\{User}\Documents\cAlgo\Data\Indicators\AIQuantumTradingEdge-V3 yoluna gidin
Renk kodlu istemler ve performans dahil birçok iyileştirme
Bu gösterge şunlardan oluşur
RangeBoxFibonacci: https://ctrader.com/products/526
OrderPrice: https://ctrader.com/products/397
TSPivot: https://ctrader.com/products/544
ve görünmeyen kısım FiboTrendPro: https://ctrader.com/products/653


