Installation and launch guide
Gallery
.png)
.png)
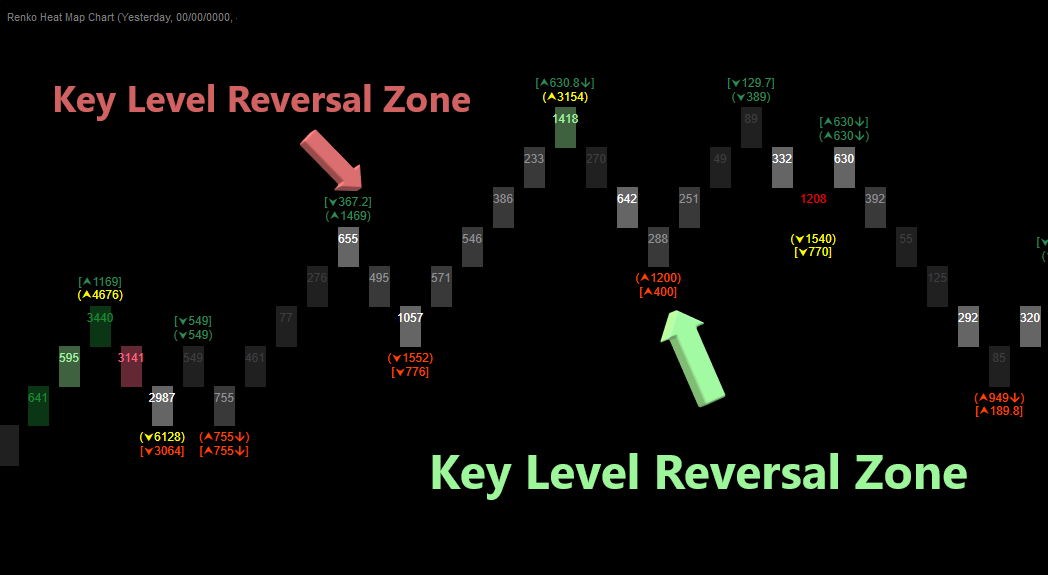
The indicator displays a heatmap within Renko candle formations, presenting lie data updates on the chart. Highlighting key Reversal Zones where significant price movements are likely to occur.


You may also like
The indicator displays a heatmap within Renko candle formations, presenting lie data updates on the chart. Highlighting key Reversal Zones where significant price movements are likely to occur.


