


Description
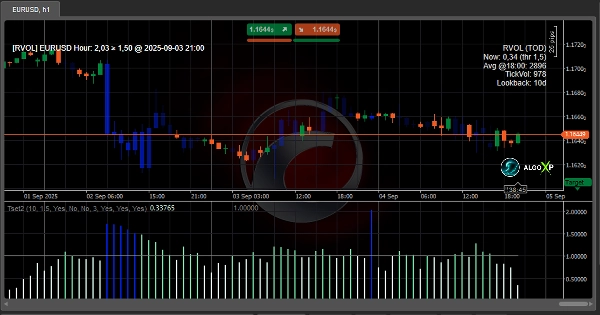
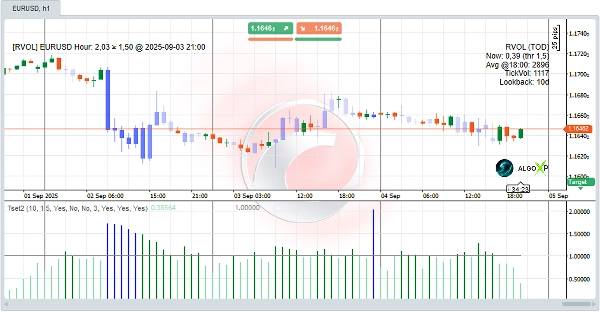
🌊 Tsunami Volume Surge (RVOL + Time-of-Day) is a precision volume tool for cTrader that shows you when the market is truly active.
Instead of looking at raw volume, Tsunami compares each bar’s activity to the average at the same time of day over your chosen Lookback Days. This time-of-day normalization exposes genuine participation spikes you can trade: treat 1.0 as “normal,” use 1.5–2.0 to confirm breakouts, and watch 3.0+ for explosive news moves. A clean RVOL histogram, dynamic candle coloring, and alerts & pop-ups make energy obvious at a glance - lightweight and fast on M1–M15 across FX, crypto, and indices. RVOL values can also feed your cBots as a simple, robust filter.
Explore more resources and a detailed FAQ on AlgoXP
⚡ How to trade with it (quick start)
- Add Tsunami on your chart (M1–M15 works great). Set Lookback Days (start with 20–30).
- Keep Baseline 1.0 visible. RVOL < 1.0 = quiet; ≥ 1.5–2.0 = confirm breakouts; ≥ 3.0 = news surge.
- Turn on Enable Alerts and choose Alert On Close Only (safer) or intrabar (faster).
- Use Colorize Bars for instant read of energy; adjust Bar Color to taste.
- (Optional) In cBots, read the RVOL series to filter signals to active windows only.
🚀 Result: Tsunami turns volume into a time-aware edge - helping you skip dead periods, confirm real breakouts, and react faster when the market wakes up.
Summary
Key features include an RVOL histogram, dynamic candle coloring for quick visual assessment, and customizable alerts with pop-ups. It operates efficiently on short timeframes (M1 to M15) and supports multiple markets such as Forex, cryptocurrencies, indices, commodities, and stocks. Additionally, RVOL values can be integrated into cBots as filters to refine automated trading signals.
The indicator aims to provide a time-aware volume edge, enabling traders to avoid low-activity periods, confirm breakouts, and respond promptly to market surges. Users can adjust settings like lookback days, alert preferences, and bar colors to tailor the tool to their trading style.
Discussion
Customer reviews
5 | 75 % | |
4 | 25 % | |
3 | 0 % | |
2 | 0 % | |
1 | 0 % |
FAQ














Price