Indicator
NAS100
NZDUSD
XAUUSD
Commodities
Forex
EURUSD
GBPUSD
BTCUSD
Indices
Prop
Stocks
Supertrend
Crypto
USDJPY
ADXVMA Aurora Trend Filter
"ADXVMA  Aurora Trend Filter" logo
18/09/2025
2
Desktop
Since 13/08/2025
Sales
16
Free installs
220
"ADXVMA  Aurora Trend Filter" uploaded image"ADXVMA  Aurora Trend Filter" uploaded image"ADXVMA  Aurora Trend Filter" uploaded image"ADXVMA  Aurora Trend Filter" uploaded image

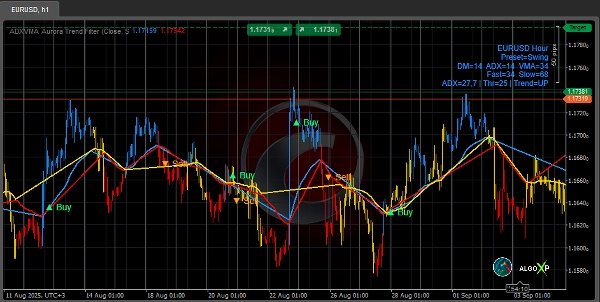
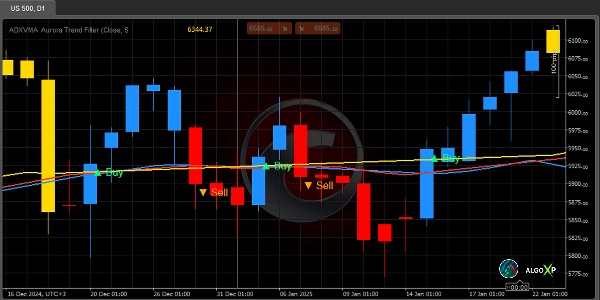
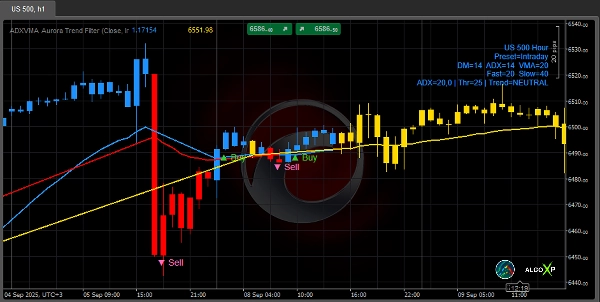
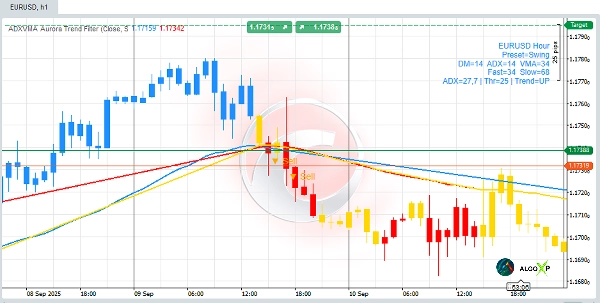
⚡ ADXVMA Aurora Trend Filter combines ADX trend strength with an adaptive EMA blend to form a reliable trading baseline. Unlike ordinary indicators with fixed smoothing, Aurora adjusts in real time—closer to price in strong trends, smoother in ranges—and displays a clean Up / Down / Neutral bias with optional crossover arrows. The result is more responsiveness than static MAs and more stability than ADX alone.

🆚 Why it’s stronger than ordinary indicators

  • Versus fixed MAs: the adaptive coefficient reduces lag in trends and filters chop in ranges.
  • Versus raw ADX: turns strength into a tradeable baseline (with colors & cross signals), not just a number.
  • Versus generic filters: an ADX-weighted fast/slow EMA delivers a balanced mix of sensitivity and stability.

🧠 The engine: ADX-weighted EMA blend

ADX (0…100) measures trend strength. Aurora blends a fast and a slow EMA, using ADX as the weight:

  • High ADX → bias toward fast (lower lag).
  • Low ADX → bias toward slow (better noise filtering).

The line is color-coded by slope (and can be gated Neutral when ADX is weak), yielding a clean Blue / Red / Yellow read.

🔭 What it does

  • Adaptive baseline: blends fast & slow EMA using ADX as the weight.
  • Three-state colors: Blue (Up), Red (Down), Yellow (Neutral).
  • Color Bars: candle coloring for instant context.
  • Crossover arrows: modes By Trend (Classic) or All Crosses (Simple).
  • Dashboard: live periods, ADX and trend state.
  • Bot-ready: hidden series TrendState (−1/0/+1) and ADX for cBots/scanners.

🎯 How to trade it

  • Bias: Above line + blue → focus longs; below line + red → focus shorts; yellow → stand aside.
  • Entry: take the arrow on price crossing the baseline (choose By Trend or All Crosses).
  • Exit: stop at Aurora line ± buffer; take profit via RR≥2 or on opposite cross/color flip.

🚀 Presets (quick start)

  • Scalp: VMA=12 · ADX=14 · ADX-Thr=28 · NeutralSlope=0.04 · Link=VMA→2×VMA
  • Intraday: VMA=20 · ADX=14 · ADX-Thr=25 · NeutralSlope=0.06 · Link=VMA→2×VMA
  • Swing: VMA=34 · ADX=14 · ADX-Thr=23 · NeutralSlope=0.10 · Link=VMA→2×VMA
  • Position: VMA=55 · ADX=14 · ADX-Thr=20 · NeutralSlope=0.15 · Link=VMA→2×VMA

🔧 Key parameters

  • DM / ADX / VMA Periods (separate, Wilder-style).
  • Use genuine DM (Wilder): strict +DM/−DM (recommended On).
  • Adapt Link: Link to VMA (Fast=VMA, Slow≈2×VMA) or Manual Fast/Slow.
  • Neutral Slope (pips): slope sensitivity per bar.
  • Flat if ADX < Threshold: force Neutral during weak trend (On/Off).
  • Arrows / Color Bars / Dashboard: on/off; Arrow Mode: By Trend / All Crosses.

🎯 Perfect for:

  • Scalpers, intraday and swing traders wanting a clear trend filter + simple triggers
  • Algo traders needing stable, machine-readable series.


🧭 Timeframe & Market Tips

  • Lower TFs (M1–M5): more noise → start with VMA 10–14, NeutralSlope 0.04–0.08, ADX Thr 25–30.
  • Intraday (M15–H1): VMA 18–24, NeutralSlope 0.06–0.12, ADX Thr 22–28.
  • Higher TFs (H4–D1): VMA 30–60, NeutralSlope 0.10–0.25, ADX Thr 20–25.
  • Majors vs. Volatile (XAU, Crypto): increase VMA / NeutralSlope / Threshold one notch for volatile markets.


More from this author
cBot
Grid
XAUUSD
Prop
+3
Maya Gold Grid ATR - TEST VERSION
🌞 Smart Gold Grid. ATR Precision. + 1 800 000% ROI in 6 years backtest 🌞
cBot
Grid
Prop
XAUUSD
+3
Maya Gold Grid ATR
🌞 Smart Gold Grid. ATR Precision. +35% in 30 Days🌞
Indicator
NAS100
NZDUSD
XAUUSD
+11
Samurai Breakout Lite
⚔️Limited version. Draws clean session box (Tokyo / London / New York / Overlap) and optional breakout plan (EP/TP/SL)⚔️
Indicator
NAS100
NZDUSD
Breakout
+12
Samurai Breakout Pro II
⚔️Full breakout trading workstation: session box, EP/TP/SL levels, on-chart ✓/✗ outcomes, pro-level analytics and more⚔️
Indicator
NAS100
NZDUSD
XAUUSD
+12
Coral Filter Lite
🐠 Free trend baseline - without the noise. Free limited version of Coral Filter X Pro 🐠
Indicator
NAS100
NZDUSD
Breakout
+13
Meridian Pivot Points Pro
🚀See the market’s framework, decide faster. Session-Aware Pivots. Auto Presets. Pro-Grade Zones.🚀
Indicator
NAS100
NZDUSD
XAUUSD
+11
Support and Resistance Lite
🟢 Real swing-based support & resistance with ATR-powered half-bands 🔴
Indicator
NAS100
NZDUSD
XAUUSD
+10
Atlas Seasonal Returns Heatmap
🧭 See when your market tends to move—by Month, Day-of-Week, or Hour-of-Day🧭
Indicator
NAS100
NZDUSD
XAUUSD
+12
Coral Filter X Pro
🐠 Coral Filter X Pro turns trend detection into a simple, repeatable workflow 🐠
Indicator
NAS100
NZDUSD
XAUUSD
+10
Nebula Range Filter Pro
⚡Nebula Range Filter is a professional trend filter indicator for cTrader⚡
Indicator
NAS100
NZDUSD
XAUUSD
+10
Tsunami Volume Surge - RVOL
🌊 See when the market is truly in play. Tsunami measures Relative Volume by time-of-day 🌊
You may also like
OHLC PRO by LudwigICT
OHLC PRO – Advanced Session & Market Structure Tool
Indicator
Breakout
Commodities
Forex
+3
MAGIC BLOCK STRATEGY
Block Liquidity,indicator.Block Order, Liquids Stops, Signal Sentiment,signal correction
Indicator
Grid
Martingale
Signal
+2
Trend Pulse X
is a trend-following indicator designed to provide a clear view of market direction, momentum, and strength
Indicator
Signal
DARK POLL SIGNAL_noSourceCode
Dark Poll Signal Indicator.liquidity leakage,precedes the great movement, accumulation, distribution
Indicator
RSI
Breakout
XAUUSD
+6
Fair Value Gap Sessions
identify and highlight temporary market inefficiencies known as "fair value gaps" 🚨 within specific trading Sessions.
calculateSpreads_withSourceCode
Indicator calculates spread in pips
Big Candel
1 Candel High Time Freme
Indicator
Stocks
Forex
Crypto
PinBarCandlestickPattern
PinBarCandlestickPattern Indicator
VegaXLR - RSI and StochRSI Alerts
VegaXLR's cTrader StochRSI identifies overbought/oversold RSI levels for precise trade entries.
MAMA CANDLES
This code implements the MESA Adaptive Moving Average (MAMA) indicator, it creates candles based on MAMA calculations.
Previous Day Equilibrium (Premium & Discount)
Plots the equilibrium price levels based on previous daily highs and lows.
Rsi buy Sell Signal
Instant‑setup RSI scalper—designed for turbulent markets.
Top-rated
"STC" logo
5.0
(2)
Free
STC
Schaff Trend Cycle (STC) Indicator
Time To Break Even Indicator v2
Time To Break Even Indicator. This indicator helps you time your trade's entry.
Indicator
Indices
Stocks
Forex
+2
HorizontalSupportResistance
This extraordinary multi-timeframe support and resistance indicator is nothing short of market wizardry.
Renko Line Chart
Smart Signal Reversal Trend + Patterns
IVB 2.0
IVB 2.0 is an indicator that works on the strategy of imbalance of the maximum volatility box of indices
Indicator
Indices
Signal
Whale Hunting For boom crash
The **Whale Hunting Indicator** is a trading tool for **Boom & Crash and Volatility indices**, featuring **Auto Trend De