"bountykilla" logo
bountykilla
"bountykilla" uploaded image
42.1M
Traded volume
6.13M
Pips won
143
Sales
5.93K
Free installs

Bounty Killer – the indicator that hunts stop-loss liquidity before the big players do.

Bounty Killer is a cTrader indicator designed for traders who love to trade stop hunts / liquidity grabs: those candles that spike above highs or below lows, clear out stops and then reverse in the opposite direction.

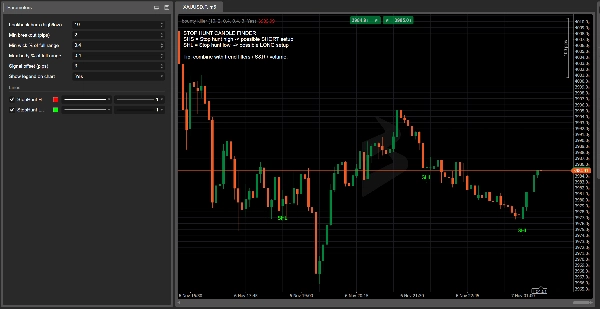
The indicator automatically scans every candle and flags:

  • SHS (Stop Hunt High) – probable stop hunt above recent highs → area to look for short setups
  • SHL (Stop Hunt Low) – probable stop hunt below recent lows → area to look for long setups

The detection logic is built around:

  • breaking recent highs/lows by at least X pips,
  • a long wick extending beyond that level,
  • a small body and a close in the opposite direction of the breakout.

No more guessing “maybe this was a stop hunt”: Bounty Killer highlights the key candles directly on your chart, with clear labels, colors and an on-chart legend.

Why traders like it:

  • Shows where the market may have grabbed liquidity and where a reversal becomes more meaningful.
  • Fully customisable: lookback window, minimum breakout in pips, body/wick percentages, signal offset.
  • Combines perfectly with classical support/resistance, supply & demand, volume, order blocks and SMC concepts.
  • Great for traders who follow liquidity-based setups but want something objective and rule-based instead of pure eyeballing.

⚠️ Bounty Killer is not a full trading system and does not open or close trades.
The marked candles are high-information zones that should be integrated with your own strategy, trend analysis and risk management.

Indicator profile
0.0
Reviews: 0
Customer reviews
No reviews for this product yet. Already tried it? Be the first to tell others!
BTCUSD
Forex
Signal
Breakout
RSI
Indices
EURUSD
Commodities
GBPUSD
NZDUSD
MACD
Prop
Scalping
ATR
Supertrend
SMC
Crypto
Stocks
XAUUSD
NAS100
USDJPY
Products available through cTrader Store, including trading bots, indicators and plugins, are provided by third-party developers and made available for informational and technical access purposes only. cTrader Store is not a broker and does not provide investment advice, personal recommendations or any guarantee of future performance.

More from this author

Read aggressive flow in real time. Flexible resets (Day/Week/Month), optional EMA smoothing, and non-repainting cumulati
The Prop-Ready Bot The Definitive Automaton for Challenges 🛡️ V2.0
Editions: Free (core VWAP + bands) · Pro (multi‑VWAP, click‑to‑anchor, alerts).
A price-action-first algorithm to trade Breakout, Approach, and Return around prior High/Low levels—with Prop-style risk
Volume Bubbles is a lightweight yet powerful visual indicator for cTrader
The Elliott Wave Pro Bot is a sophisticated and highly configurable algorithmic trading system
N.B.: Results with an initial invested capital of 100 euros.
AILevelTrader — Multi-AI Consensus Trading Bot 11 AI providers. One consensus. Prop Firm Ready.
1.9
Profit factor
4%
Max drawdown
Want a cBot based on this indicator? Contact us!
Breakout scalping with prop-firm grade equity control.
ZigZag Free is a clean swing-detection tool that marks significant pivot highs/lows
✅ Buy 3 prop accounts and manage just 1: cut management effort by 66% with a professional tool.

You may also like

FREE PRICE ACTION INDICATOR. Good for beginners struggling with trend bias.
💹 Define a price channel 📈 and determine trend direction (bullish 🟢 or bearish 🔴).
Cumulative delta candles + volume profile
🚀 Specialized algorithm is designed to confirm entry and exit points with precision 🎯
Non-repainting Fractal + ZigZag indicator with smart filtering. True market structure. No future function, no drift.
Multi-timeframe pivot points with 8 support/resistance levels. Professional trading tool for precise entry/exit points.
ANCHORED DELTA CANDLE VOLUME PROFILE
Deep Mood Distribution (DMD) is a segmented volume-profile and sentiment tool that analyzes price action in fixed bar bl
Rate Of Change Indicator is easy to use and measures the intensity of price action change to the upside or downside
Decision System Indicator According to Cosmic Laws
Overview of the Fade Breakout Visualizer Indicator
A simple tool to control market sessions. For Tokyo,London, New York
Volume Bubbles is a lightweight yet powerful visual indicator for cTrader
Super Arrows
Price Action Zone shows previous D/W/M key levels to help frame intraday price action, liquidity, and market structure.
Candle Timer & Strength DEMO for cTrader This is a DEMO version of the Candle Timer & Strength indicator. You can use al
An indicator that redefines ATR by applying a percentile-based filter giving traders a grounded view of volatility.
Plots intraday VWAP and dynamic ±1/±2 standard deviation (SD) bands based on current day’s price and volume.
42.1M
Traded volume
6.13M
Pips won
143
Sales
5.93K
Free installs