


Description
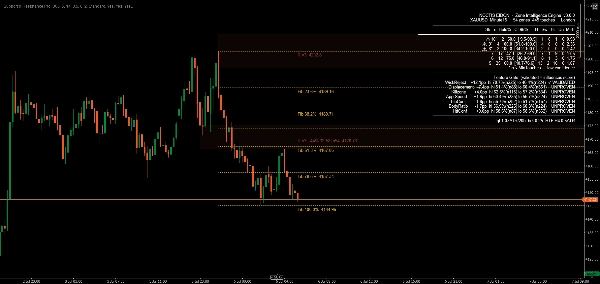
Support & Resistance Pro identifies support and resistance zones and — unlike most S/R tools — measures whether those zones actually work, using an independent statistical engine built on real historical data rather than assumption. Every zone shows a hold-rate statistic with a confidence interval, calculated from the complete historical zone population, including zones that later broke and disappeared from the chart. Most indicators in this category only count the levels still visible today, which quietly inflates every strength claim made. This one doesn't.
Key Features
- Statistically Validated Zones Every zone carries a real, historically-measured hold rate with a 95% confidence interval — not an assumed strength score. One signal, wick rejection at the point of contact, has been formally validated: confirmed on EURUSD and Bitcoin, across multiple timeframes, including a genuine out-of-sample test where the effect held strength on unseen data.
- Automatic Role Reversal Broken support automatically becomes resistance, and vice versa, with a distinct visual marker — the indicator tracks which side of price a zone sits on and colors it accordingly, rather than fixing color to how the zone originally formed.
- Higher-Timeframe Confluence Zones on your chart are checked against a higher timeframe of your choice, with matching HTF structure drawn directly on the chart as a separate visual overlay.
- Fibonacci Retracement Integration Automatic Fibonacci retracement levels from the most recent swing, each labeled with both ratio and exact price in your broker's native precision, decluttered automatically against nearby zones so labels never overlap.
- Saturation Warning Zones tested too many times are flagged rather than assumed stronger — our data shows heavily-tested zones tend to perform worse, not better, likely because their resting liquidity has already been used up.
- Open Validation Gate Six additional candidate signals — body ratio, approach speed, session/killzone timing, and displacement testing — are shown live on the built-in statistics panel with their own hold-rate readouts. They do not influence any score or ranking until each independently clears the same evidence bar wick rejection did. You see exactly what's proven and what isn't.
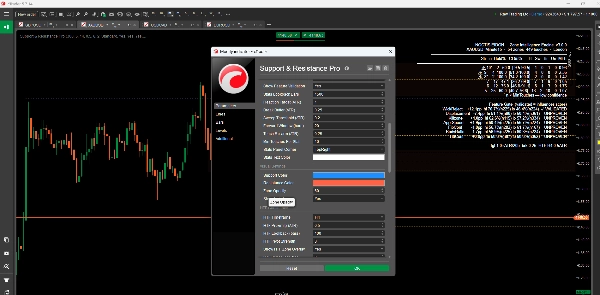
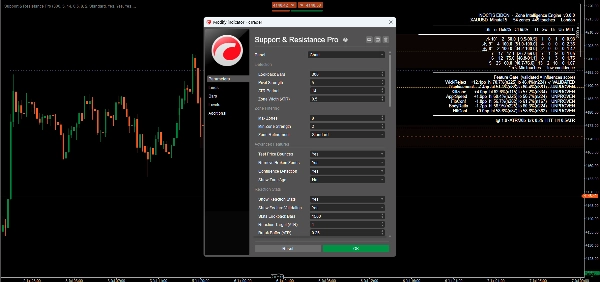
- Customizable Settings Extensive parameter control across detection sensitivity, zone filtering, visual styling, and alert behavior.
- Real-Time Alerts Configurable pop-up, email, and sound alerts for zone touches, breakouts, and confluence events, independently toggleable per channel.
Benefits
- Evidence over assumption: every statistic on the chart can be independently checked — the indicator includes its own in-sample/out-of-sample verification tools
- No survivorship bias: strength claims are built on the complete historical zone population, not just the levels that happened to survive
- Honest disclosure: proven and unproven signals are labeled as such, on the chart, at all times
Ideal For
Traders who want to see the statistical evidence behind a level, not just a line — day traders, swing traders, and systematic traders across forex, crypto, and other instruments seeking a rigorously measured approach to support and resistance.
Conclusion
Support & Resistance Pro is built around one principle: a strength claim isn't real until it's measured. One signal has cleared that bar with cross-instrument, cross-timeframe, and out-of-sample confirmation. The rest are shown honestly as still being tested — because a number you can't verify isn't worth showing at all.
Summary
- Dynamic support and resistance levels that adjust in real-time based on recent price action.
- Multi-timeframe analysis to view levels across different timeframes for a comprehensive market overview.
- Calculation and display of pivot points to mark potential intraday reversal zones and target prices.
- Highlighting of psychological price levels (round numbers) to gauge market sentiment.
- Integration of Fibonacci retracement levels to assist in identifying support and resistance during price corrections.
- Customizable settings for lookback periods, visualization styles, and color schemes to suit individual trading preferences.
- Clear graphical representation for easy identification of market conditions.
- Configurable real-time alerts when prices approach critical levels.
This indicator supports various trading styles including scalping, day trading, and swing trading, and is suitable for traders in forex, commodities, stocks, and indices markets. It is intended for both beginner and experienced traders seeking structured market analysis and enhanced decision-making through reliable support and resistance data.
Customer reviews
5 | 100 % | |
4 | 0 % | |
3 | 0 % | |
2 | 0 % | |
1 | 0 % |
Discussion
FAQ




























Price