
Description
VOLUME HEATMAP PRO - Professional Market Density Visualization
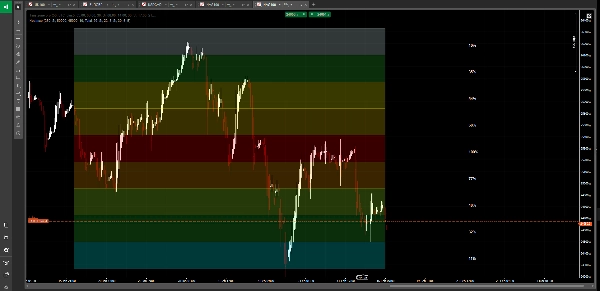
See the market like never before with this advanced volume heatmap that transforms complex volume data into an intuitive visual display. Unlike traditional volume indicators that only show bars at the bottom of your chart, Volume Heatmap Pro reveals exactly where institutional traders are accumulating and distributing positions across every price level.
KEY FEATURES:
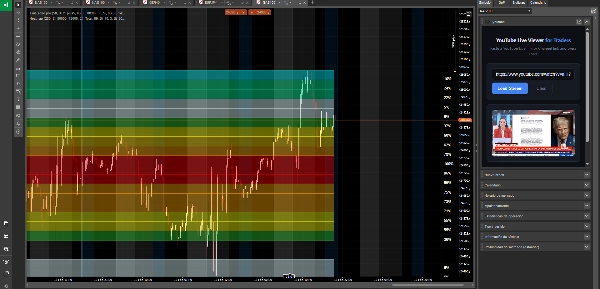
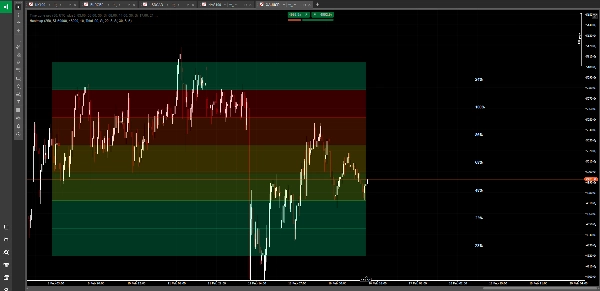
🔥 Dynamic Color-Coded Heatmap
Experience volume analysis through a stunning 10-tier color gradient system. From icy blue (minimal activity) to blazing red (maximum volume), instantly identify where the big money is flowing. The heatmap updates in real-time, showing you market density at a glance.
📍 Point of Control (POC) Detection
Automatically identifies and highlights the price level with the highest trading volume - the market's true equilibrium point. This is where institutions have built their largest positions and where price tends to return.
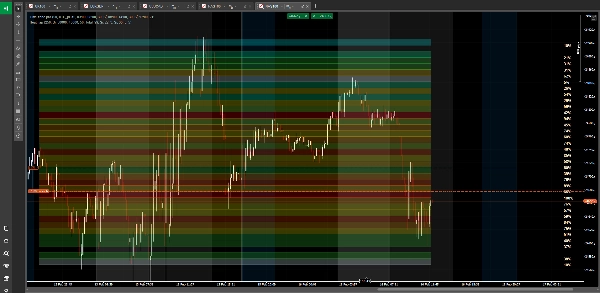
🎯 Multi-Level Volume Distribution
Divides your price range into up to 50 precise levels, creating a detailed map of volume distribution. See exactly which prices attracted heavy trading and which were ignored by the market.
📊 Three Volume Analysis Modes
• Total Volume - See all market activity
• Buy Volume Only - Isolate bullish pressure zones
• Sell Volume Only - Identify bearish distribution areas
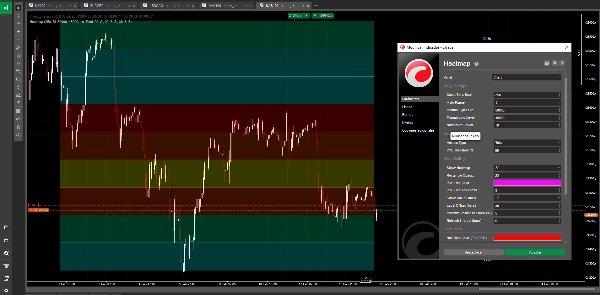
🎨 Professional Visualization
• Color-coded rectangles spanning your analysis period
• Adjustable opacity for perfect chart integration
• Optional volume percentage labels on each level
• Customizable POC line with thickness control
• Clean, non-intrusive display
⚙️ Smart Auto-Range Technology
Automatically calculates optimal price range from your lookback period, or manually define your own range for specific analysis. The heatmap adapts to any market condition or timeframe.
🔄 Performance Optimized
Configurable refresh intervals ensure smooth chart performance while maintaining accurate volume analysis. Analyze up to 500 bars back without lag.
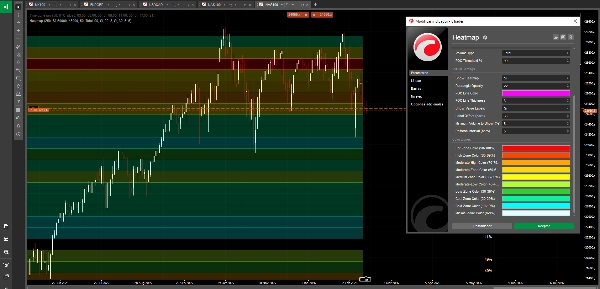
📈 Customizable Color Zones
Personalize all 10 color zones to match your visual preferences:
• Hot Zone (90-100%) - Maximum volume concentration
• High Zone (80-89%) - Strong activity
• Moderate-High (70-79%) - Above average volume
• Moderate (60-69%) - Solid activity
• Medium (50-59%) - Average volume
• Moderate-Low (40-49%) - Below average
• Low Zone (30-39%) - Light activity
• Cool Zone (20-29%) - Minimal trading
• Cold Zone (10-19%) - Very light volume
• Minimal (0-9%) - Nearly no activity
PERFECT FOR:
• Identifying institutional accumulation and distribution zones
• Finding low-volume nodes for potential breakout areas
• Spotting high-volume support and resistance levels
• Understanding market structure and liquidity
• Confirming trade entries at high-volume areas
• Avoiding low-liquidity trap zones
• Multi-timeframe volume profile analysis
WHAT MAKES IT DIFFERENT:
Traditional volume indicators show you how MUCH was traded, but not WHERE. Volume Heatmap Pro reveals the complete picture - a visual density map showing exactly which price levels absorbed the most trading activity. The gradient color system makes complex volume analysis as simple as reading a weather map. Red means hot (heavy volume), blue means cold (light volume).
Whether you're scalping intraday reversals or positioning for swing trades, this heatmap shows you where the market has true conviction versus where it's just noise.
---
⚠️ RISK DISCLAIMER:
Trading foreign exchange, cryptocurrencies, and other financial instruments carries a high level of risk and may not be suitable for all investors. The high degree of leverage can work against you as well as for you. Before deciding to trade, you should carefully consider your investment objectives, level of experience, and risk appetite. There is a possibility that you may sustain a loss of some or all of your investment. Therefore, you should not invest money that you cannot afford to lose. You should be aware of all the risks associated with trading and seek advice from an independent financial advisor if you have any doubts. Past performance is not indicative of future results.
Summary
Key features include automatic Point of Control (POC) detection, highlighting the price level with the highest trading volume, and multi-level volume distribution dividing the price range into up to 50 levels for detailed analysis. It supports three volume modes: total volume, buy volume only, and sell volume only, enabling users to isolate bullish or bearish pressure zones.
The indicator offers professional visualization with adjustable opacity, customizable color zones, optional volume percentage labels, and a customizable POC line. Smart auto-range technology calculates optimal price ranges based on the lookback period or manual input. Performance is optimized for smooth updates and analysis of up to 500 bars without lag.
Heatmap is suitable for identifying institutional accumulation and distribution zones, spotting support and resistance levels, understanding market structure, and conducting multi-timeframe volume profile analysis across markets including Forex, indices, and XAUUSD (gold).
Customer reviews
5 | 67 % | |
4 | 33 % | |
3 | 0 % | |
2 | 0 % | |
1 | 0 % |


!["[Stellar Strategies] Market Session Ultimate" logo](https://cdn.ctrader.com/image/webp/61ffd537-0125-4246-9e72-42eca1791d64_28232)


