"Atrriskvisualizer" logo
Indicator
Version 1.0, Apr 2026
Windows, Mac
4.5
Reviews: 2
"Atrriskvisualizer" uploaded image
Since 07/10/2025
1
Sales

━━━━━━━━━━━━━━━━━━━━━━━━━━━━━━━━━━━━━━━━

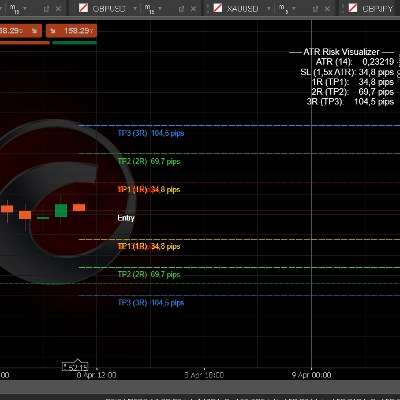
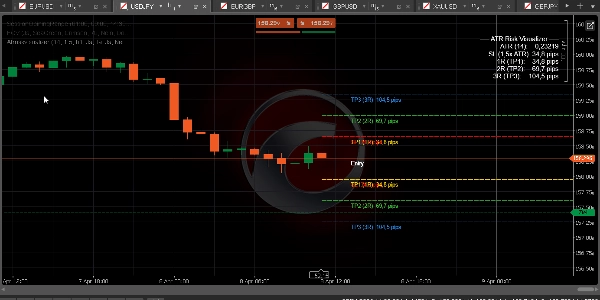
ATR Risk Visualizer — Risk

━━━━━━━━━━━━━━━━━━━━━━━━━━━━━━━━━━━━━━━━


Instantly visualizes your Stop Loss and Take Profit levels based on ATR — with full R-multiple mapping (1R to 5R) and pip labels — so you always trade with defined risk before entering a position.


─────────────────────────────

KEY FEATURES


► ATR-based Stop Loss — SL distance calculated as ATR × configurable multiplier (default 1.5×)

► R-Multiple Take Profits — TP1 (1R), TP2 (2R), TP3 (3R), TP4 (4R), TP5 (5R) drawn automatically from current price

► Pip labels on every level — see exact pip distance for SL and each TP at a glance

► Long and Short levels simultaneously — or switch to Long-only or Short-only mode

► ATR Timeframe selector — calculate ATR from a higher timeframe (e.g. H1 ATR on M15 chart)

► ATR Info Panel (top right) — shows ATR value, SL size, and TP1/2/3 in pips

► Full color control — separate colors for SL, TP1, TP2, TP3, TP4/5 via native cTrader color pickers

► Configurable line style (Solid / Dashes / Dots) and thickness

► Ask or Bid price as entry reference — choose based on your trade direction


─────────────────────────────

DEFAULT SETTINGS


→ ATR Period 14

→ ATR Multiplier 1.5× (SL = 1.5 × ATR)

→ ATR Timeframe H1

→ Show TP1/2/3 ON

→ Show TP4/5 OFF

→ Direction Both (Long + Short)

→ SL Color Red

→ TP1 Color Gold

→ TP2 Color LimeGreen

→ TP3 Color DodgerBlue

→ Line Style Dashes


─────────────────────────────

HOW TO USE


1. Add the indicator to any chart

2. Set ATR Period and Multiplier to match your strategy (1.5× ATR is standard for Forex/Gold)

3. Set ATR Timeframe to H1 or H4 for smoother SL sizing

4. Read the pip values directly from the chart labels

5. Use TP1 (1R) for first partial exit, TP2 (2R) for break-even, TP3 (3R) for full target

6. Combine with BOS/CHoCH and FVG indicators for a complete SMC entry workflow


─────────────────────────────

IDEAL FOR


✔ FTMO and prop firm traders who must size risk precisely

✔ SMC and ICT traders using R-multiples for trade management

✔ Forex, Gold, and Indices traders on any timeframe

✔ Traders who want a clear visual risk map before every entry

✔ Anyone building a systematic approach to position sizing


─────────────────────────────

COMPATIBILITY


→ Platform cTrader (Desktop & Web)

→ Asset classes Forex, Indices, Commodities, Crypto CFDs

→ Timeframes All (M1 to MN)

→ Access Rights None required

→ Account type Live & Demo


━━━━━━━━━━━━━━━━━━━━━━━━━━━━━━━━━━━━━━━━


Indicator profile
Indicator category
Market structure (SMC)
Output type
Visualisation
Data requirements
Bars only
Supported signals
Session opening range
Level break
Volatility
Breakout
Reversal
4.5
Reviews: 2
5
50 %
4
50 %
3
0 %
2
0 %
1
0 %
Customer reviews
April 21, 2026
it helped mostly by making bad ideas easier to skip.
April 19, 2026
ATR Risk Visualizer provides a clear way to map SL and TP levels using ATR and R-multiples. It’s a useful tool for risk planning and trade structuring. However, in its current state, extended TP levels can distort chart scaling, making price action hard to read. With minor visual adjustments, this could become a very strong risk management tool.
Forex
Indices
EURUSD
Commodities
GBPUSD
NZDUSD
Prop
Fair Value Gap
SMC
Crypto
XAUUSD
NAS100
ATR
USDJPY
Products available through cTrader Store, including trading bots, indicators and plugins, are provided by third-party developers and made available for informational and technical access purposes only. cTrader Store is not a broker and does not provide investment advice, personal recommendations or any guarantee of future performance.

More from this author

Indicator
SMC
Prop
+6
Automatically draws the Opening Range (High & Low) for Tokyo, London, and New York sessions. Configurable start times,
Indicator
SMC
Prop
+12
Killzone, ICT, SMC, Session, Asia, London, New York, NY PM, Session High, Session Low, Smart Money, Order Flow, Trading
Indicator
SMC
Prop
+12
Shows bullish/bearish bias for 5 timeframes in one panel. Three bias methods, alignment summary, fully configurable.

You may also like

Indicator
Signal
Order Flow Market Depth Pro | Footprint & DOM
Indicator
Volume
Key Levels
+4
Session & Kill Zone Highlighter - Visual tool for London, NY, Tokyo, Sydney sessions plus ICT Kill Zones.
Indicator
EMA
RSI
+2
Advanced TDI indicator with Shark Fin signals, chart arrows, MTF RSI, divergence detection and smart alerts.
Indicator
Forex
BTCUSD
+11
Sero is a stochastic-based momentum oscillator that gives clear, color-coded visual signals for market momentum shifts.
Indicator
Prop
Forex
+12
🚨Detection of geometric price patterns (Harmonic Patterns) and market structures based on price action📈
Indicator
MACD
Crypto
A simple tool to control market sessions. fixed the display on the weekend.
Indicator
AI
ATR
+27
The Support & Resistance Pro helps traders identify key support and resistance levels for informed trading decisions.
Indicator
BOS
Fibonacci
+4
Automatically draws major trading sessions, killzones, and SMC daily liquidity targets directly on your cTrader charts.
Indicator
ATR
RSI
+6
🔍 MultiScalpScorePRO – Powerful real-time scoring system combining indicators for ultra-precise scalping signals.
Indicator
Prop
Forex
+11
🌊 See when the market is truly in play. Tsunami measures Relative Volume by time-of-day 🌊
Indicator
Prop
Forex
+14
Key Levels Indicator – Automatically plots monthly, weekly, and daily highs/lows with customizable colors & styles
Indicator
Forex
BTCUSD
+5
Buy-Side & Sell-Side Liquidity (BSL/SSL) Indicator
Indicator
ATR
RSI
+7
Track the Movement of Market Assets with an Oscillator Scanner in Real-Time!
Indicator
Prop
Forex
+5
Transform your approach to trading with our innovative Pivot Point Indicator.
Indicator
price quote
Indicator
Volume
Order Block
+4
Volume Profile with fixed period, custom range and buy/sell pressure.
Indicator
AI
ATR
+27
Overbought Oversold Indicator
Indicator
Market Structure
Support & Resistance
Auto-centers price when it moves beyond threshold. Adjustable zoom. Works on any chart type. Never lose price again.
Since 07/10/2025
1
Sales