present
Sign up and get $50 off your first purchase
Trading product for Smart Fibonacci Entry Indicator Fibonacci Premium/Discount , image 1
Smart Fibonacci Entry
Indicator
Version 1.0, Jul 2026
Windows, Mac
Trading product for Smart Fibonacci Entry Indicator Fibonacci Premium/Discount , image 2
Trading product for Smart Fibonacci Entry Indicator Fibonacci Premium/Discount , image 3
Trading product for Smart Fibonacci Entry Indicator Fibonacci Premium/Discount , image 4
Trading product for Smart Fibonacci Entry Indicator Fibonacci Premium/Discount , image 5
45
Sales
2.96K
Free installs

Description

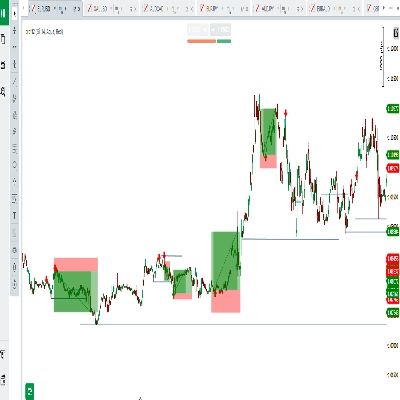
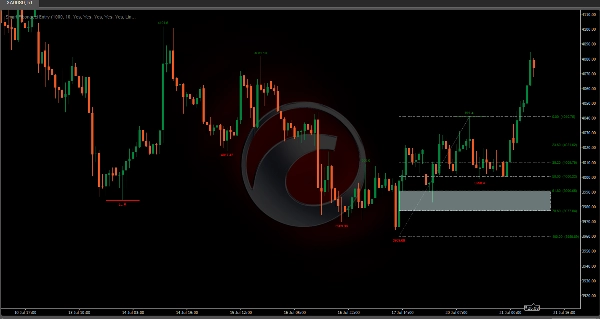
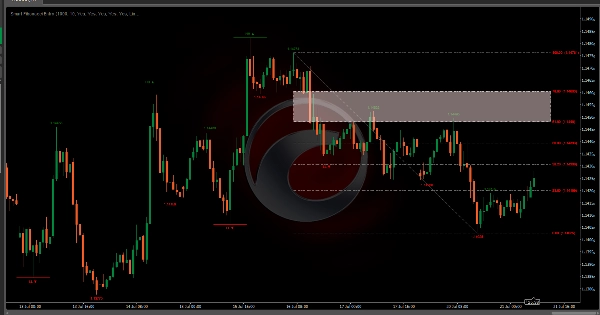
The Smart Fibonacci Entry is an automated structural analysis tool,  detects Break of Structure (BOS) events and automatically anchors a Fibonacci grid to the most relevant swing points. It specifically highlights the ENTRY zone, where institutional buying or selling typically occurs after a trend confirmation.

Detection


Swing Detection: The script monitors price for structural Swing Highs and Swing Lows based on your chosen pivot length.

Fibonacci Direction Shift Recognition: A direction shift is confirmed when pivot price exceeds the previous Swing Pivot High (Higher High), and a down direction shift is confirmed when price drops below the previous Swing Pivot Low (Lower Low).

Dynamic Stretching: Once a direction is established, the Fibonacci grid "breathes" with the market. If the trend continues to make new highs or lows, the grid automatically stretches to include the new extension, ensuring your retracement levels are always mathematically accurate.

Entry Zone

The Entry zone is the primary focus of this indicator. Based on ICT (Inner Circle Trader) concepts, the Entry zone represents the "sweet spot" of a retracement.

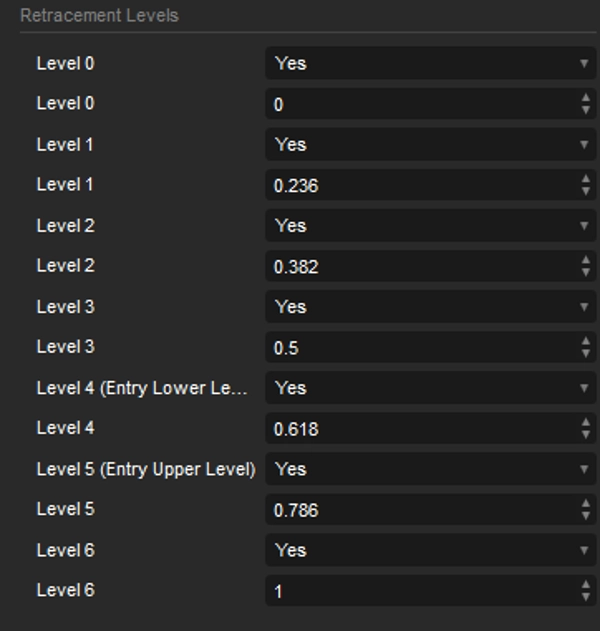
The Range: By default, the zone is plotted between the 0.618 and 0.786 Fibonacci levels.

Discount/Premium: In a bullish trend, price retreating into the Entry zone is considered "buying at a discount." In a bearish trend, a rally into the Entry zone is "selling at a premium."

Visual Clarity: The zone is highlighted with a colored box (teal for bull, rose for bear), making it easy to identify exactly where to look for price action reversal signals.

Features:

Structure Labels: Automatically marks HH (Higher High) and LL (Lower Low) points with Break-of-Structure (BOS) lines.

Swing Diagonal: A dotted line connects the two anchor points of the Fibonacci grid, providing a clear visual representation of the current swing's slope and magnitude.

Extended Levels: Horizontal Fibonacci lines (0.236, 0.382, 0.5, etc.) are projected across the chart, with price-sensitive labels that update every tick, these parameters can be easily customized.

Indicator Settings

Main Settings

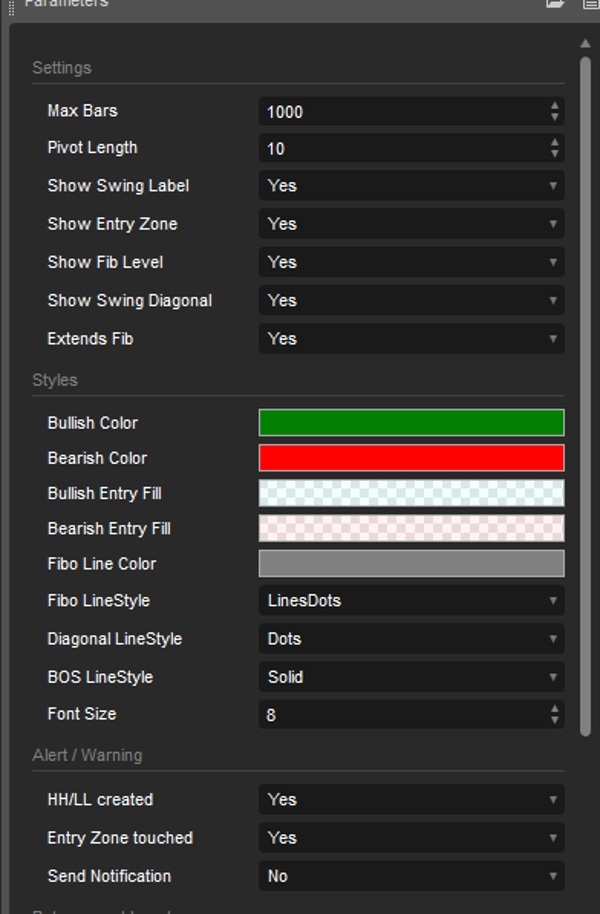
  • Pivot Length: Adjust this to filter between micro-structure (short length) and macro-structure (long length).
  • Max Bars: The indicator starts calculating based on the number of historical candlesticks.
  • Fibonacci Levels: Fully customizable boundaries for your entry zone and other levels.
  • Visual Styles: Change line styles (Solid, Dashed, Dotted) and colors for the grid, labels, and structure shifts to match your chart theme.

Trading

  • Entries: Instead of "chasing" a breakout, wait for the indicator identify the higher high or lower low, then wait for price to return to the Entry box.
  • Confluence Tool: Use the Entry zone in conjunction with Order Blocks or Liquidity Sweeps. When an Entry zone aligns with a previously swept EQL or EQH, the probability of a reversal increases significantly.
  • Objective Profit Taking: Use the 0.0 (origin) and various extension levels as objective targets for scaling out of positions.

Styles and Alert

  • Styles: Adjust object line style, color configuration. 
  • Alert: Turn alerts on/off when Entry Zone First Touched and New LL/HH created.
Summary

Indicator profile
Indicator category
Trend
Output type
Visualisation
Data requirements
Bars only
Supported signals
Trend strength
Volatility

Discussion

Customer reviews

0.0
Reviews: 0
Customer reviews
No reviews for this product yet. Already tried it? Be the first to tell others!

FAQ

Fibonacci
Premium/Discount
BOS
Market Structure
Products available through cTrader Store, including trading bots, indicators and plugins, are provided by third-party developers and made available for informational and technical access purposes only. cTrader Store is not a broker and does not provide investment advice, personal recommendations or any guarantee of future performance.

More from this author

Indicator
SMC
Forex
+7
The Fair Value Gap (FVG) Indicator identifies inefficiencies in price action where an imbalance occurs due to aggressive
Indicator
SMC
Forex
+7
Simple Smart Money Concepts (SMC)
Indicator
Forex
BTCUSD
+6
The Market Sessions indicator is a popular tool for visually representing global trading sessions on a price chart.
Indicator
SMC
Forex
+5
Pure Price Action ICT Tools
Indicator
MACD
Forex
+5
MACD Indicator with Histogram that plots Colors Based on Direction Above and Below the Zero Line.
Indicator
Forex
BTCUSD
+6
All-In-One solution for ICT's FVG IFVG ORDERBLOCK in advanced mode.
Indicator
Forex
BTCUSD
+5
Simple ICT Concepts
Indicator
Forex
BTCUSD
+4
The Linear Regression Oscillator (LRO) is a technical indicator based on linear regression analysis.
Indicator
Forex
BTCUSD
+5
This indicator displays the OrderBlocks of the current and higher timeframe, made by ICT's student.
Indicator
ATR
BOS
+3
Fair Value Gaps with Multi-Timeframe.
Indicator
BOS
MSS
+3
Orderblocks with Multi-Timeframe.
Indicator
Forex
BTCUSD
+4
This indicator is designed to perform multiple non-linear regression analysis using four independent variables.

You may also like

Indicator
Forex
cTrader Auto Support & Resistance detects key levels with Fibonacci analysis and sends real-time trading alerts.
Indicator
ATR
Wedge
+2
Strong Supertrend Turn Market Movement into a Clear Map Market analysis
Indicator
Forex
Crypto
Bar Close Alert Manager provides real-time alerts for bar closures with customizable notifications and automation.
Indicator
RSI
MACD
+7
The ZigZag indicator is a technical analysis tool primarily used to identify key price reversal points.
Indicator
ATR
Forex
+7
Final Moving Average is an adaptive system designed to keep traders aligned with the true direction of the market
Indicator
AI
Prop
+9
Phoenix Zones - Detector de Reversiones Críticas
Indicator
Doji
Volume
+5
Instantly spot high-liquidity institutional moves with clean, non-obtrusive triangle alerts on cTrader charts.
Indicator
The long awaited new and improved Supply Demand Premium V2 indicator. Unlock greater trading opportunities now!
Indicator
RSI
Signal
+2
Identifies trends with moving averages & volatility. Base levels = bullish 🐂 or bearish 🐻 signals. Reversals detected!
Indicator
ATR
MSS
+5
Advanced market structure and institutional cycle mapper with visual reference cards and entry alerts
Indicator
VWAP
Support & Resistance
Trading.FC$_vwap Algo shows VWAP trends, dynamic support/resistance and deviation bands to spot potential trade entries.
Indicator
Prop
Forex
+11
🧭 See when your market tends to move—by Month, Day-of-Week, or Hour-of-Day🧭
Indicator
ZigZag
Indices
+2
Auto Trendlines, Fibonacci, Pitchfork and Patterns from non‑repainting pivots. One‑click Presets, targeted Alerts, and a
Indicator
ATR
Upgrade to ATR-RMA! Experience the precise ATR using Relative Moving Average for accurate volatility analysis in cTrader
Indicator
Forex
BTCUSD
+11
Next-gen Volume Oscillator using Hyperbolic Tangent math. No repainting. Includes arrows, alerts, and overlay mode 🎯
Indicator
Candle Timer & Strength Panel for cTrader Description: Candle Timer & Strength Panel is an advanced, always-visible over
Indicator
VWAP
Forex
+5
Trade with institutional accuracy. Identify fair price levels and high-volume zones instantly!
Indicator
ATR
BTCUSD
+5
Multi-pole Gaussian filter channel with dynamic color, Reduced Lag & Fast Response modes. Port of DonovanWall's original

Price

45
Sales
2.96K
Free installs