
📊 ОЖИДАЕМОЕ ЗНАЧЕНИЕ VPOC MONTE CARLO
https://chartshots.spotware.com/c/69c558e2c68df
Интегрированный рыночный анализ: профиль объема + статистическое прогнозирование 🎯
🎯 ЧТО ЭТО ТАКОЕ?
Ожидаемое значение VPOC Monte Carlo — это индикатор количественного анализа, который объединяет две профессиональные торговые методологии:
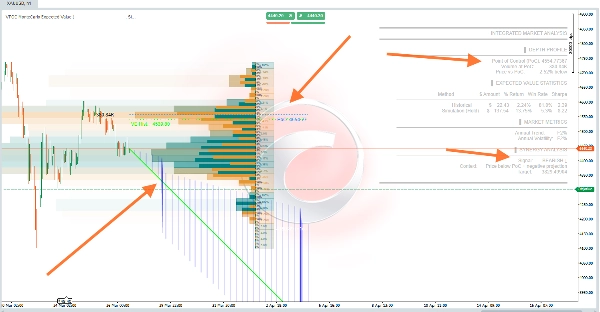
- Профиль глубины рынка (VPOC) — определяет, где действительно сосредоточен объем 🏦
- Моделирование Монте-Карло — прогнозирует будущие сценарии на основе статистических вероятностей 📈
В результате получается система анализа, которая показывает, где находятся деньги (точка контроля) и куда они, вероятно, направятся (прогнозируемое ожидаемое значение) 🧠
⚙️ КАК ЭТО РАБОТАЕТ?
Модуль 1: Профиль глубины (VPOC) 📊
Индикатор анализирует последние 200 баров (настраиваемо) и распределяет объем по 30 ценовым уровням. Он рассчитывает:
- Точка контроля (PoC): цена с наибольшим объемом торгов — представляет рыночный консенсус, где покупатели и продавцы были наиболее активны ⚖️
- Дельта: разница между покупательским и продавательским давлением на каждом уровне 🔄
- Тепловая карта: визуализация концентрации активности 🔥
Логика: цена склонна возвращаться к PoC, потому что именно там сосредоточена большая часть ожидающей ликвидности. Если цена далеко от PoC, вероятность возврата выше 🔄
Модуль 2: Статистическое прогнозирование (Монте-Карло) 🎲
Использует стохастические симуляции (по умолчанию 1000 итераций) для прогнозирования будущей цены:
- Рассчитывает исторический тренд актива и годовую волатильность 📉📈
- Генерирует случайные траектории с использованием нормального распределения (модель геометрического броуновского движения) 🌊
- Оценивает ожидаемое значение с полосами стандартного отклонения (±1 сигма) 📏
Применяемая формула: - Дрейф за бар = годовая доходность / торговые дни 🧮
- Волатильность за бар = годовая волатильность / √дней ⚡
- Прогноз = текущая цена × e^(суммарный дрейф + нормальный случайный × суммарная волатильность) 🔢
Модуль 3: Синергия 🔗
Объединяет оба анализа для генерации контекстных сигналов:
Таблица
Сигнал Условие Значение
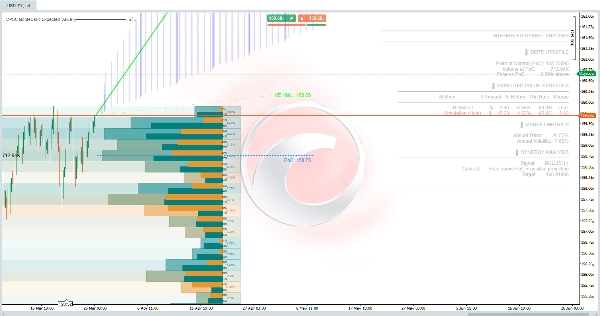
БЫЧИЙ ↑ 🟢 Цена > PoC + Положительный прогноз Подтвержденный объемом бычий тренд
МЕДВЕЖИЙ ↓ 🔴 Цена < PoC + Отрицательный прогноз Подтвержденный объемом медвежий тренд
ВОЗМОЖНОСТЬ ★ 💡 Цена < PoC + Положительный прогноз Возможный отскок от объемной поддержки
ДИВЕРГЕНЦИЯ ⚠️ ⚠️ Цена > PoC + Отрицательный прогноз Предупреждение о возможном развороте
📈 ДЛЯ ЧЕГО ЭТО ИСПОЛЬЗУЕТСЯ?
✅ Определение ключевых уровней объема — PoC действует как магнит для цены 🧲
✅ Оценка вероятностей успеха — процент выигрышных сценариев в симуляции 🏆
✅ Оценка соотношения риск/доходность — прогнозируемое значение коэффициента Шарпа и стандартного отклонения 📊
✅ Подтверждение направления сделки — синергия между позицией относительно PoC и статистическим моментумом 🎯
✅ Целевой прогноз — ожидаемые ценовые уровни на заданный период удержания 🎯
🎮 НАСТРОЙКА И ИСПОЛЬЗОВАНИЕ
Основные параметры:
Таблица
Группа Параметр По умолчанию Описание
Период анализа профиля глубины 200 баров История для расчета профиля объема
Ценовые уровни 30 Разрешение профиля (больше уровней = больше деталей) 🔍
Горизонтальное смещение 5 Позиция профиля на графике 📏
Максимальная длительность операции статистического прогноза 252 бара Горизонт времени прогноза ⏱️
Инвестированный капитал $1,000 База для денежных расчетов 💰
Симуляции 1,000 Количество случайных траекторий (больше = точнее, медленнее) 🔄
Безрисковая ставка 5% Для расчета коэффициента Шарпа 📉
Использование исторической стратегии TP/SL Нет Активировать для симуляции с фиксированными целями 🎯
Как интерпретировать таблицу результатов:
plain
Copy
СТАТИСТИКА ОЖИДАЕМОГО ЗНАЧЕНИЯ
┌──────────────┬─────────┬─────────┬─────────┬────────┐
│ Метод │ $ Сумма│ % Доход│ Процент побед│ Шарп │
├──────────────┼─────────┼─────────┼─────────┼────────┤
│ Исторический │ -$19.56 │ -1.96% │ 47.2% │ -1.24 │
│ Симуляция │ -$54.05 │ -5.40% │ 21.4% │ -4.95 │
└──────────────┴─────────┴─────────┴─────────┴────────┘
- Исторический: средняя производительность аналогичных прошлых сделок 📜
- Симуляция: средний результат 1000 симуляций Монте-Карло 🎲
- Процент побед: процент сценариев с положительным исходом ✅
- Шарп: доходность с учетом риска (больше 1 — хорошо, отрицательное — плохо) 📈
🖼️ Визуальные элементы на графике
Таблица
Элемент Цвет Значение
Профиль объема Оранжево-синий градиент Концентрация активности по ценовым уровням 🎨
Линия PoC Синяя пунктирная Точка контроля, проецируемая в будущее 🔵
Линия прогноза EV Зеленая/Магента Ожидаемая траектория цены 🟢🔴
Полосы ±1σ Белые пунктирные линии 68% диапазон доверия 📊
Линия исторического EV Зеленая пунктирная Ожидаемое значение на основе исторических данных 🟢
Зона прогноза Прозрачное синее заполнение Вероятностная область между полосами 🔵
⚠️ ВАЖНО — Ограничения
- Не является сигналом на покупку/продажу — это инструмент вероятностного анализа 🛠️
- Симуляции Монте-Карло предполагают сохранение исторического распределения (не предсказывают события "черного лебедя") 🦢❌
- PoC динамичен — пересчитывается при каждом новом баре 🔄
- Требуется достаточная история — минимум 252 бара для надежных прогнозов 📊
- Криптовалюты — индикатор автоматически адаптируется к 365 торговым дням в году против 252 для традиционных рынков 🪙
💡 Рекомендуемая стратегия использования
- Ищите ВОЗМОЖНОСТЬ ★ 💡 — цена ниже PoC, но с положительным прогнозом (возможная недооценка)
- Подтверждайте процентом побед > 50% — более высокая статистическая вероятность успеха ✅
- Избегайте ДИВЕРГЕНЦИИ ⚠️ ⚠️ — переоцененная цена относительно фактического объема
- Используйте PoC как ориентир — стопы или цели вокруг этого уровня ликвидности 🎯
- Сравнивайте Исторический и Симуляцию — если они сильно различаются, меняется рыночный режим 🔄


