คำอธิบาย
ขอบเขตน้ำหนักปริมาณ: แผนที่สมบูรณ์สำหรับแรงขับเคลื่อน cTrader
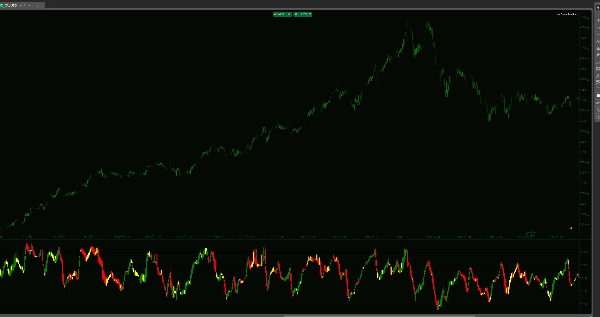
ตัวชี้วัดมาตรฐานจะแสดงให้คุณเห็นว่าราคาผ่านมาที่ไหน ตัวชี้วัด Volume-Weighted RSI Candles จะแสดงความเชื่อมั่นเบื้องหลังการเคลื่อนไหว โดยการผสานการเคลื่อนไหวของราคา ปริมาณการเทรด และระดับสถาบันสำคัญห้าระดับ เครื่องมือนี้เปลี่ยน RSI จากออสซิลเลเตอร์ธรรมดาเป็นระบบแผนที่แนวโน้มที่ครอบคลุม
แทนที่จะเป็นเส้นเดียว คุณจะได้เห็นแท่งเทียน OHLC เต็มรูปแบบในหน้าต่างตัวชี้วัดของคุณ ซึ่งช่วยให้คุณเห็น "โครงสร้าง" ของแรงขับเคลื่อน—เผยให้เห็นว่าการเคลื่อนไหวได้รับการสนับสนุนโดยปริมาณสถาบันหนักหรือเป็นเพียง "การหลอกลวง" ที่มีสภาพคล่องต่ำ
กลยุทธ์การดำเนินการ 5 โซน
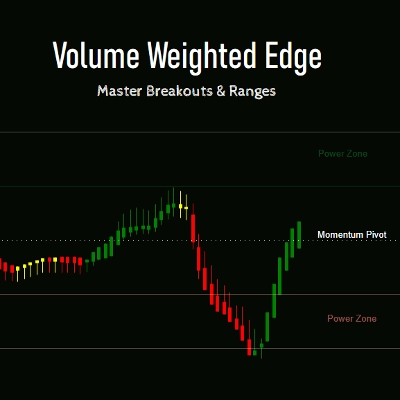
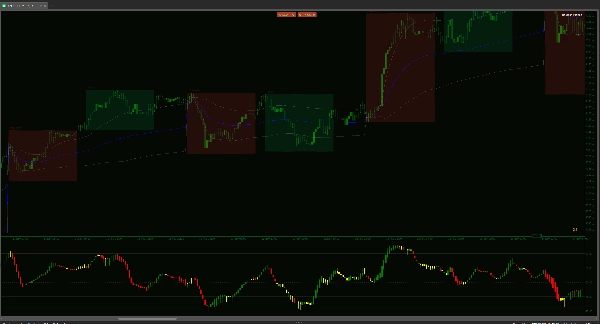
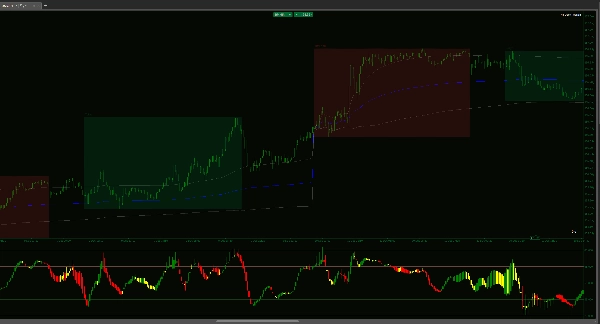
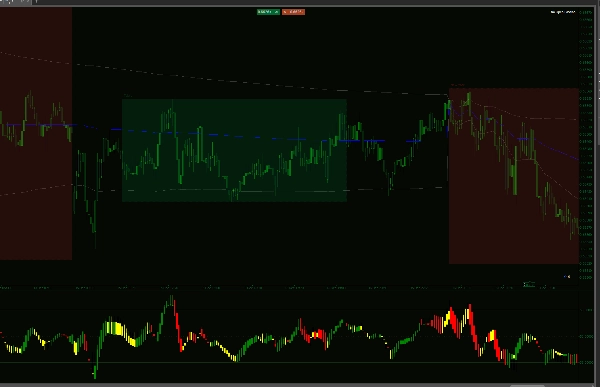
- การขยายพลัง (65–80 & 20–35): นี่คือโซนที่มีความเชื่อมั่นสูง เมื่อแท่งเทียนที่มีน้ำหนักปริมาณยืนหยัดที่นี่ คุณไม่ได้มองหาการกลับตัว—คุณกำลังขี่ตามแนวโน้ม นี่คือที่ที่เงินใหญ่ทำงาน และที่ที่เกิดการเคลื่อนไหวที่รุนแรงที่สุด
- ช่องทางการสแคปปิ้ง (50–65 & 35–50): เหมาะสำหรับเซสชันเอเชียหรือการตลาดที่มีช่วงราคาจำกัด เมื่อแนวโน้มในกรอบเวลาที่สูงกว่านั้นเป็นกลาง โซนเหล่านี้ให้เป้าหมาย "การกลับสู่ค่าเฉลี่ย" ที่มีความน่าจะเป็นสูง หากตลาดอยู่ในช่วงขอบเขต ช่องทางเหล่านี้ช่วยให้คุณสแคปการหมุนเวียนด้วยความแม่นยำสูง
- จุดหมุนแรงขับเคลื่อน (50): เส้นแบ่งสุดท้าย แท่งเทียนที่มีน้ำหนักปริมาณปิดข้ามระดับนี้เป็นการเตือนครั้งแรกของการเปลี่ยนแปลงโครงสร้างในการควบคุมตลาด
ทำไมเครื่องมือนี้ถึงเปลี่ยนวิธีการทำงานของคุณ
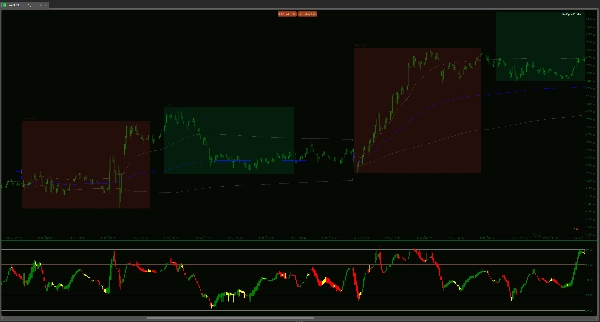
ความชัดเจนที่มีน้ำหนักปริมาณ: แท่งเทียนแต่ละแท่งถูกคำนวณโดยการคูณการเปลี่ยนแปลงราคาเข้ากับปริมาณการเทรด หากการเคลื่อนไหวเกิดขึ้นบนปริมาณบาง การยืนยันของแท่งเทียน RSI จะไม่เกิดขึ้น ซึ่งช่วยให้คุณหลีกเลี่ยงการเคลื่อนไหว "กับดัก" ที่ดูดีบนชาร์ตราคาแต่ไม่มีการสนับสนุน
ข้อมูลเชิงลึกของแท่งเทียน: เส้น RSI แบบดั้งเดิมจะสั่นและขรุขระ แท่งเทียนที่ปรับด้วย WMA ของเราจะแสดงให้คุณเห็น "เปิด" และ "ปิด" ของแรงขับเคลื่อน หากแท่งเทียน RSI หนาและมั่นคง แนวโน้มก็แข็งแรง หากไส้เทียนยาว แรงขับเคลื่อนก็หมดแรง
ความหลากหลายของตลาดหลายประเภท: * แนวโน้ม: ใช้ช่วง 65–80 เพื่ออยู่ในเทรดที่ชนะได้นานขึ้น
ช่วง/สแคปปิ้ง: ใช้ช่องทาง 35–65 เพื่อจับการหมุนเวียนอย่างรวดเร็วในช่วงเซสชันที่มีความผันผวนต่ำเช่นเอเชีย
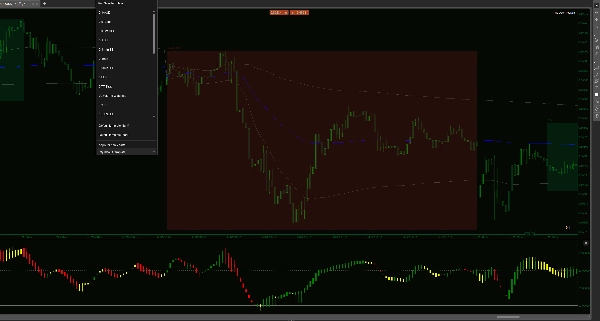
หลีกเลี่ยงกับดัก "บาร์โค้ด": ตัวชี้วัดส่วนใหญ่บังคับให้คุณเดาในช่วงที่มีความผันผวนต่ำ ตัวชี้วัดนี้มีเอฟเฟกต์ "บาร์โค้ด" ที่เป็นเอกลักษณ์ในช่วงการรวมตัว เมื่อแท่งเทียนแคบลง แบนราบ และเป็นกลาง ตัวชี้วัดกำลังบอกคุณว่า "เครื่องยนต์ตลาด" ปิดอยู่ การเตือนด้วยภาพนี้ช่วยให้คุณไม่เข้าไปในกับดักที่มีปริมาณต่ำและไม่ถูก "สับ" เมื่อไม่มีเงินจริงสนับสนุนการเคลื่อนไหวของราคา
การปรับแต่งเฉพาะสำหรับ cTrader: สร้างขึ้นโดยเฉพาะสำหรับ C# API ด้วยตรรกะ "Max Visual Candles" เพื่อให้แพลตฟอร์มของคุณตอบสนองได้ดี แม้ในชาร์ต 1 นาที
หยุดการเทรดโดยอิงจากที่ตลาดอาจไป เริ่มเทรดโดยอิงจากที่ปริมาณจริง ๆ กำลังผลักดัน ตัวชี้วัดนี้ไม่ใช่แค่เกี่ยวกับสัญญาณ—แต่เป็นการเข้าใจพลังงานภายในของตลาด
สรุป
รีวิวจากลูกค้า
5 | 33 % | |
4 | 67 % | |
3 | 0 % | |
2 | 0 % | |
1 | 0 % |


