
คำอธิบาย
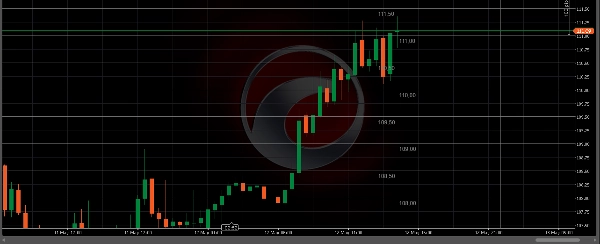
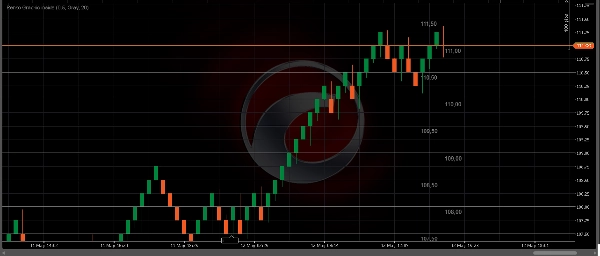
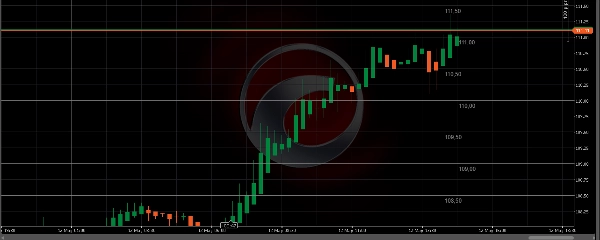
ตัวบ่งชี้ที่กำหนดเองนี้วาดเส้นกริดแนวนอนที่ปรับแต่งได้บนกราฟทุกประเภท (Renko, Candlestick, Line, Tick, Range, Volume, Point & Figure และ Kagi) ช่วยให้นักเทรดมองเห็นระดับบล็อกของกรอบเวลาที่สูงกว่าบนกราฟกรอบเวลาที่ต่ำกว่าโดยตรง รองรับการวิเคราะห์หลายกรอบเวลาโดยไม่ต้องสลับหน้าต่าง
คุณสมบัติหลัก:
- ใช้งานได้กับกราฟทุกประเภท (Renko, Candles, Line, Tick, Range, Volume, PnF, Kagi)
- กำหนดระยะห่างของกริดได้ (ตั้งแต่ 0.1 จุดขึ้นไป)
- ปรับจำนวนเส้นกริดได้ (4 ถึง 50 เส้น)
- ปรับสีเส้นได้เพื่อการมองเห็นที่ดีขึ้น
- ป้ายระดับราคาที่สร้างขึ้นโดยอัตโนมัติสำหรับการอ้างอิงอย่างรวดเร็ว
กรณีการใช้งานในการเทรด:
- ระบุระดับแนวรับและแนวต้าน
- วิเคราะห์หลายกรอบเวลาในกราฟเดียว
- แสดงขอบเขต "บล็อกที่สูงกว่า" บนกราฟ Renko ที่ต่ำกว่า
- ระบุโซนราคาสำคัญสำหรับการเข้าและออก
รายละเอียดทางเทคนิค:
- ประเภทตัวบ่งชี้: การซ้อนทับภาพ / เส้นกริด
- ใช้งานได้กับ: ทุกกรอบเวลา (ระยะห่างของกริดขึ้นอยู่กับราคา ไม่ใช่เวลา)
- เข้ากันได้กับ: Forex, ดัชนี, สินค้าโภคภัณฑ์, Crypto, หุ้น
⚠️ ข้อจำกัดความรับผิดชอบ: การเทรดมีความเสี่ยงที่จะขาดทุน ผลการดำเนินงานในอดีตไม่รับประกันผลลัพธ์ในอนาคต ตัวบ่งชี้นี้เป็นเครื่องมือภาพและไม่สร้างสัญญาณการเทรด โปรดใช้การบริหารความเสี่ยงอย่างเหมาะสมเสมอ
📌 คุณอาจชอบ:
ตรวจสอบตัวบ่งชี้มืออาชีพอื่นๆ ของฉันที่มีใน cTrader Store:
🔵 คะแนนคุณภาพสัญญาณ - คะแนน 0-100 เพื่อกรองการเข้า (RSI, Volume, ATR, Trend) - ดูสินค้า
🟢 ตัวตรวจจับสภาวะตลาด - ระบุตลาดที่มีแนวโน้ม, ช่วงตัว และผันผวน พร้อมการตรวจจับการดึงกลับ - ดูสินค้า
🟠 ไฮไลท์โซนฆ่าช่วงเวลา - แสดงช่วงเวลาการซื้อขายลอนดอน, นิวยอร์ก, โตเกียว, ซิดนีย์ และ ICT Kill Zones - ดูสินค้า
⚙️ ศูนย์เลื่อนอัตโนมัติอัจฉริยะ - รักษาราคากลางบนกราฟของคุณพร้อมการควบคุมซูมด้วยตนเอง - ดูสินค้า
เยี่ยมชมโปรไฟล์ของฉันเพื่อดูสินค้าทั้งหมด: CapitalMente บน cTrader Store
สนับสนุน:
สำหรับคำถามหรือคำขอคุณสมบัติ ติดต่อฉันผ่าน cTrader Store
วิธีใช้:
เพียงแนบตัวบ่งชี้ไปยังกราฟใดก็ได้และปรับพารามิเตอร์ "Higher Renko Size" เพื่อกำหนดระยะห่างของกริด จำนวนเส้นและสีสามารถปรับแต่งได้อย่างเต็มที่
สรุป
Key features include adjustable grid spacing starting from 0.1 points, a customizable number of grid lines ranging from 4 to 50, and selectable line colors for enhanced visibility. The indicator automatically labels price levels for quick reference.
This tool supports various markets such as Forex, Indices, Commodities, Crypto, and Stocks, and works across all timeframes since the grid spacing is price-based rather than time-based. It is primarily used to identify support and resistance levels, visualize higher brick boundaries on lower Renko charts, and highlight key price zones for trade entries and exits.
To use, attach the indicator to any chart and set the "Higher Renko Size" parameter to define grid spacing. The number of lines and their colors can be fully customized to suit individual preferences. This indicator serves as a visual aid and does not generate trading signals.
รีวิวจากลูกค้า
5 | 67 % | |
4 | 33 % | |
3 | 0 % | |
2 | 0 % | |
1 | 0 % |