present
Zarejestruj się i otrzymaj 50 $ zniżki na pierwszy zakup
Trading product for Royal liquidity X Wskaźnik Supertrend Liquidity Sweep, image 1
Royal liquidity X
Wskaźnik
Wersja 1.0, May 2026
Windows, Mac
Trading product for Royal liquidity X Wskaźnik Supertrend Liquidity Sweep, image 2
Trading product for Royal liquidity X Wskaźnik Supertrend Liquidity Sweep, image 3
86
Sprzedaż
1.18K
Bezpłatne instalacje

Opis

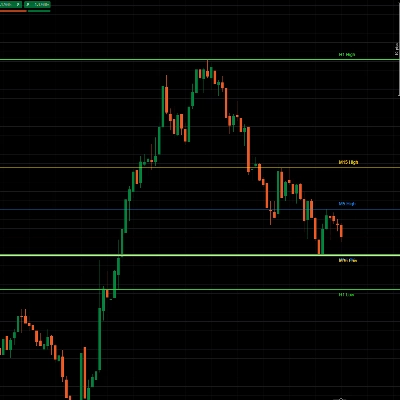
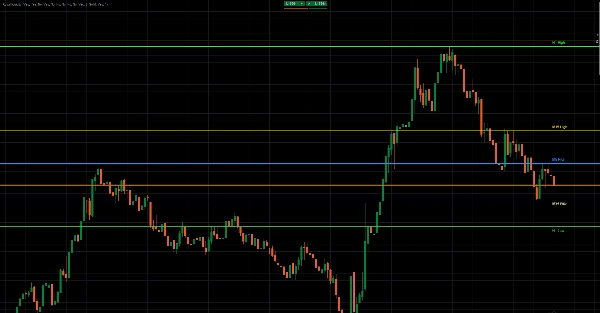
Royal Liquidity X is a clean and powerful multi-timeframe liquidity level indicator designed to display the previous high and previous low from multiple key timeframes directly on the chart.

The indicator helps traders quickly identify important liquidity zones where price may react, sweep liquidity, reject, break out, or continue with momentum. By plotting previous highs and lows from timeframes such as M5, M15, M30, H1, H2, H3, H4, H8, H12, and D1, Royal Liquidity gives traders a clear overview of the most relevant intraday and higher-timeframe liquidity levels.

These previous highs and lows are often watched by traders because they can act as potential stop-loss zones, breakout areas, reversal points, or price magnets. Royal Liquidity makes these levels visible automatically, without the need to manually draw them every session.

How It Works

Royal Liquidity reads the most recently closed candle from each selected timeframe. For every enabled timeframe, it takes the previous candle’s high and low and plots them as horizontal levels on the active chart.

For example:

M15 High = High of the last closed M15 candle
M15 Low = Low of the last closed M15 candle
H1 High = High of the last closed H1 candle
H1 Low = Low of the last closed H1 candle
D1 High = High of the last closed daily candle
D1 Low = Low of the last closed daily candle

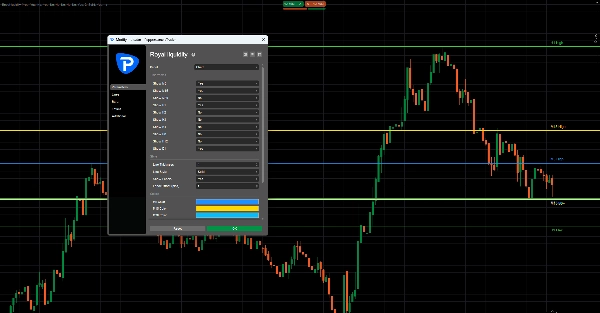
The indicator updates only on the latest chart bar, keeping the chart efficient and lightweight. Each timeframe can be turned on or off individually, and every level can have its own custom color. Traders can also adjust line thickness, line style, labels, and label offset.

What It Shows

Royal Liquidity can display:

Previous M5 High / Low
Previous M15 High / Low
Previous M30 High / Low
Previous H1 High / Low
Previous H2 High / Low
Previous H3 High / Low
Previous H4 High / Low
Previous H8 High / Low
Previous H12 High / Low
Previous D1 High / Low

Each level is drawn as a horizontal line, with optional labels such as M15 High, M15 Low, H1 High, H1 Low, and D1 High / Low.

Trading Use Cases

Royal Liquidity can help traders identify:

Liquidity sweeps
Price may move above a previous high or below a previous low to collect liquidity before reversing.

Breakout zones
A strong break above a previous high or below a previous low can signal continuation or momentum.

Reversal areas
Previous highs and lows can act as important reaction zones where price may reject.

Intraday targets
Higher-timeframe highs and lows can be used as potential target zones.

Market structure context
The indicator helps traders see where price is trading relative to important previous candle levels.

Short Marketplace-Style Version

Royal Liquidity is a multi-timeframe previous high and low indicator built to reveal key liquidity levels directly on your chart. It automatically plots the previous highs and lows from selected timeframes, including M5, M15, M30, H1, H4, H12, and D1.

Designed for liquidity-based traders, breakout traders, scalpers, and intraday traders, Royal Liquidity helps identify potential sweep zones, breakout areas, reversal levels, and profit targets with a clean visual layout.

Disclaimer

Royal Liquidity is a technical analysis tool and does not guarantee profitable trades. It should be used together with risk management, market structure analysis, and a complete trading plan.

Podsumowanie

Profil wskaźnika
Kategoria wskaźnika
Trend
Typ wyjścia
Sygnały
Wymagania dotyczące danych
Dane tickowe
Obsługiwane sygnały
Przełamanie
Przecięcie
Przebicie poziomu
Odwrócenie trendu

Dyskusja

Opinie klientów

0.0
Opinie: 0
Opinie klientów
Ten produkt nie ma jeszcze opinii. Wypróbowałeś(-aś) go już? Bądź pierwszy(-a) i powiedz o tym innym!

Częste pytania

Supertrend
Liquidity Sweep
Liquidity Grab
Produkty dostępne za pośrednictwem cTrader Store, w tym boty handlowe, wskaźniki i wtyczki, dostarczane są przez deweloperów zewnętrznych i udostępniane wyłącznie w celach informacyjnych oraz w celu zapewnienia dostępu technicznego. cTrader Store nie jest brokerem i nie zapewnia doradztwa inwestycyjnego, nie udziela spersonalizowanych rekomendacji ani nie gwarantuje przyszłych wyników.

Więcej od tego autora

Wskaźnik
AI
ATR
+27
SR Commander is a clean and intelligent support and resistance indicator for cTrader, built to help traders identify key
Wskaźnik
AI
ATR
+20
Buy and Sell Signals
Wskaźnik
AI
ATR
+27
WICK COMMANDER — Know Exactly When the Market Commits
Wskaźnik
AI
ATR
+27
Overbought Oversold Indicator
Wskaźnik
AI
ATR
+20
Know Sure Thing (KST) momentum engine
Wskaźnik
AI
SMC
+5
Coloring trendline/ Colored Trendline / Color Trendline
Wskaźnik
AI
ATR
+27
VWAP Sniper Elite -- Institutional Trend Engine
Wskaźnik
AI
SMC
+13
Dynamic Liquidity Depth exposes hidden volume
Wskaźnik
AI
ATR
+26
Entry Momentum MACD Power Guide
Wskaźnik
AI
ATR
+27
The Professional “All-in-One” Trading Suite (buy and sell indicator)
Wskaźnik
AI
ATR
+26
SR Commander — Multi Timeframe Edition. See where the big money draws the line. Trade on your timeframe. Think on theirs
Logo „crossover 1”
Najwyżej oceniane
4.2
(5)
$19
/
$29
Wskaźnik
AI
Grid
+10
Crossover Buy and Sell Alerts and signals

Możesz także polubić

Wskaźnik
VWAP
Volume
+3
Don't trust static support and resistance levels, this indicator combines Fibonacci and VWAP in one powerful tool.
Wskaźnik
ATR
Wedge
+2
Strong Supertrend Turn Market Movement into a Clear Map Market analysis
Wskaźnik
ATR
BTCUSD
+5
Trailing algo 📈 auto-tracks trends 🎯 adapts to volatility 🌟 precise moves 🛡️ retest signals 🚀 no lag, smart market
Wskaźnik
AI
ATR
+27
An advanced VWAP with multi-VWAP (Daily/Weekly/Monthly/Anchored), click-to-anchor, configurable alerts, a stats panel,
Wskaźnik
Laser entries with pivot confirmation. No repaint, all timeframes. Professional results.
Logo „ZigZagSmartAlert”
Najwyżej oceniane
4.2
(4)
$19
/
$30
Wskaźnik
ZigZag Smart Alert for cTrader Description: ZigZag Smart Alert is a next-generation swing indicator for cTrader, designe
Wskaźnik
AI
ATR
+26
Entry Momentum MACD Power Guide
Wskaźnik
ATR
EMA
+5
Candle timer with live profit tracking on chart – displays pips, currency value, and percentage in real time.
Wskaźnik
RSI
MACD
+7
The ZigZag indicator is a technical analysis tool primarily used to identify key price reversal points.
Wskaźnik
Signal
Trades Opening Range Breakouts Indicator with dynamic stops/targets adapting to market volatility.
Wskaźnik
Forex
BTCUSD
+6
All-In-One solution for ICT's FVG IFVG ORDERBLOCK in advanced mode.
Wskaźnik
ATR
MSS
+5
Advanced market structure and institutional cycle mapper with visual reference cards and entry alerts
Wskaźnik
Forex
Crypto
+3
Perfect Trend
Wskaźnik
AI
ATR
+26
Session Volume Profile + Composite. POC/VAH/VAL, Focus/Solo. Fast, clean, no ghosts, live-ready.
Wskaźnik
ATR
MACD
+15
MACD Advanced -- It combines the standard MACD logic with a rich set of visual tools
Wskaźnik
VWAP
Support & Resistance
Trading.FC$_vwap Algo shows VWAP trends, dynamic support/resistance and deviation bands to spot potential trade entries.
Wskaźnik
BOS
CHOCH
+5
A professional-grade cTrader indicator for traders following the Inner Circle Trader (ICT) methodology. It replaces 6–8
Wskaźnik
Forex
Crypto
+5
Automatically plots Fibonacci retracement levels using the highest and lowest points of a customizable time range

Cena

86
Sprzedaż
1.18K
Bezpłatne instalacje