
Best RSI Indicators for cTrader
Discover RSI indicators for cTrader that help spot momentum shifts and potential reversals on your chart. Compare classic RSI, multi-timeframe views, divergences, and alert-enabled chart tools that fit different trading strategy styles. Useful for Forex, XAUUSD, and indices when you want clearer overbought/oversold context and cleaner entries.
Công cụ
So sánh công cụ
Câu hỏi thường gặp














So sánh công cụ
Sản phẩm | Đánh giá | Lượt tải | Lượt bán | Giá | Nền tảng tương thích |
|---|---|---|---|---|---|
Supply Demand - BasicV1 | 5.0 (3) | 1.37K | — | Miễn phí | Windows, Mac |
VegaXLR - RSI and StochRSI Alerts | 4.8 (4) | — | 18 | từ $10 | Windows, Mac |
StochasticRSI | 5.0 (2) | 1.25K | — | Miễn phí | Windows, Mac |
SmartBot-MACD & RSI Indicator | 4.4 (5) | — | 4 | $19 | Windows, Mac |
RSI Trend Trigger | 4.7 (3) | 1.07K | — | Miễn phí | Windows, Mac |
Fair Value Gap (Extended) | 5.0 (1) | 937 | — | Miễn phí | Windows, Mac |
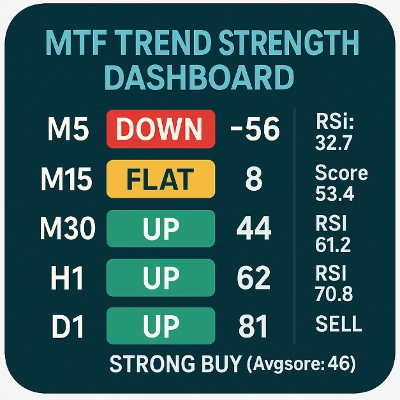
Multi Timeframe Trend Scanner | 5.0 (3) | 931 | — | Miễn phí | Windows, Mac |
Laguerre RSI | 5.0 (1) | 687 | — | Miễn phí | Windows, Mac |
Repiptor Candlescope Lite | 5.0 (1) | 637 | — | Miễn phí | Windows, Mac |
Advanced RSI Indicator | 5.0 (1) | 564 | — | Miễn phí | Windows, Mac |
Rsi buy Sell Signal | 3.5 (2) | 390 | — | Miễn phí | Windows, Mac |
RSI Reversal Hunter pro | 5.0 (1) | 372 | — | Miễn phí | Windows, Mac |
Coral Filter Lite | — | 359 | — | Miễn phí | Windows, Mac |
Repiptor RSI Amplified | 5.0 (1) | 339 | — | Miễn phí | Windows, Mac |
Samurai Breakout Lite | — | 328 | — | Miễn phí | Windows, Mac |
Zero Lag Exponential Moving Average | — | 301 | — | Miễn phí | Windows, Mac |
Candle Timer & Strength Demo | — | 300 | — | Miễn phí | Windows, Mac |
RSI Channel Trigger | — | 280 | — | Miễn phí | Windows, Mac |
Rsi_custom | 5.0 (1) | 277 | — | Miễn phí | Windows, Mac |
REDGREENZONEREVERSAL | 5.0 (1) | 270 | — | Miễn phí | Windows, Mac |
Stochastic RSI Indicator | 5.0 (1) | 262 | — | Miễn phí | Windows, Mac |
Rsi Scalp Indi | 5.0 (1) | 248 | — | Miễn phí | Windows, Mac |
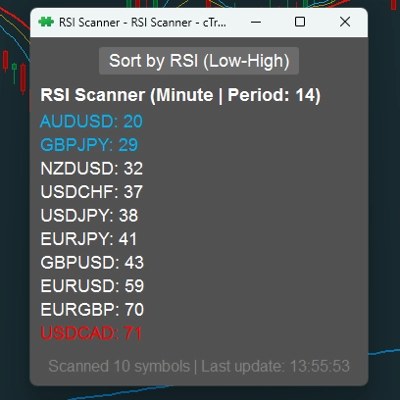
RSI Scanner | — | 246 | — | Miễn phí | Windows, Mac |
Quantitative Qualitative Estimation | 5.0 (2) | 216 | — | Miễn phí | Windows, Mac |
Candle Timer & Strength Panel Demo - | — | 214 | — | Miễn phí | Windows, Mac |
Momentum Trend Analyzer | — | 210 | — | Miễn phí | Windows, Mac |
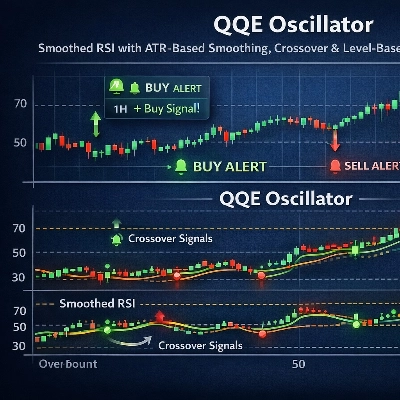
QQE | — | 201 | — | Miễn phí | Windows, Mac |
QQE_MTF | 4.0 (1) | 192 | — | Miễn phí | Windows, Mac |
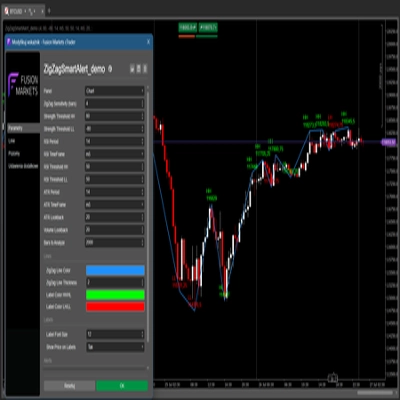
ZigZagSmartAlert_demo | — | 186 | — | Miễn phí | Windows, Mac |
WHT AIRRA | — | 184 | — | Miễn phí | Windows, Mac |
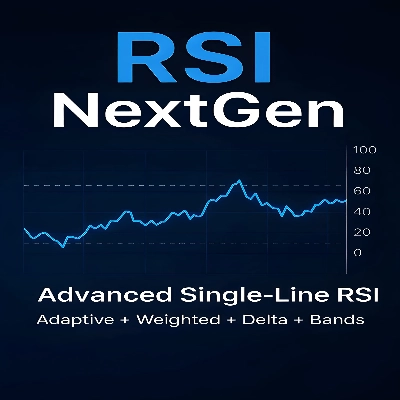
RSI NextGen | 4.0 (1) | 182 | — | Miễn phí | Windows, Mac |
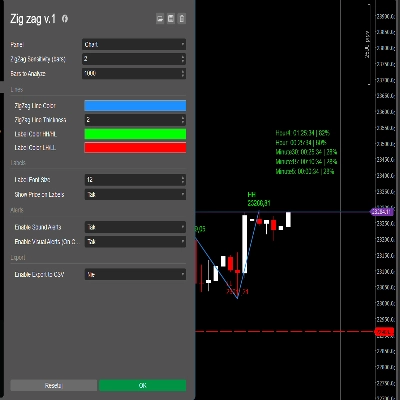
Zig zag v.1 Demo | 5.0 (1) | 177 | — | Miễn phí | Windows, Mac |
Moving Average Channel | — | 144 | — | Miễn phí | Windows, Mac |
Range 10 Rsi | — | 143 | — | Miễn phí | Windows, Mac |
Bars color 1 | 5.0 (1) | 109 | — | Miễn phí | Windows, Mac |
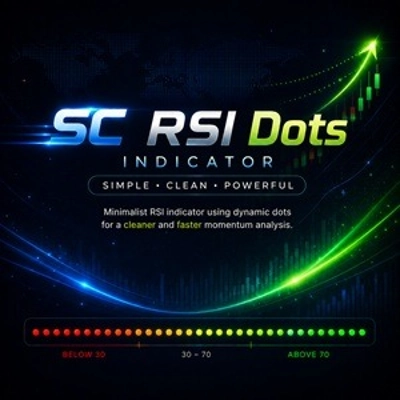
SC RSI Dots | 5.0 (1) | 68 | — | Miễn phí | Windows, Mac |
Câu hỏi thường gặp
The relative strength index (RSI) compares the average size of recent up-closes with recent down-closes and scales the result from zero to one hundred. The usual lookback is fourteen periods; readings above seventy are commonly called overbought and below thirty oversold, with fifty as the midpoint.
Many read a drop back below seventy, not the first touch, as a sign of fading upward momentum; the mirror applies to a rise back above thirty. Others watch the fifty line for trend bias, or divergence, where price makes a new extreme that the oscillator does not confirm.
In a strong uptrend average gains keep outweighing losses, so the reading can sit above seventy for many bars as price climbs. The same happens below thirty in persistent downtrends, which is why fading every extreme reading can lead to a string of losses.
No, an indicator only calculates and draws, and it cannot send orders. Automating RSI rules needs a cBot; the Help Centre's sample RSI cBot illustrates the idea by buying below thirty and selling above seventy, and its notes suggest adding a stop loss and backtesting first.
The oscillator is applied to forex, indices, gold, stocks and crypto on anything from M5 to daily charts, since it needs only a price series. Levels behave differently per symbol and period, so test it on past data for each one in cTrader's desktop apps for Windows and Mac, where custom RSI versions run.