คำอธิบาย
🔥 Pinescritlabs
Ctrader Store indicators: 🤖Pinescritlabs Ctrader Store cBots:
Fair Value Gap Sessions Gold & BTC Breakout Session Pivots
Dynamic Market Structure
Analysis of Turning Points
Fibonacci Linear
Regression Multi-timeframe
Multi-Level Candle Bias
Tracker
Auto Support and
Resistance Trend Lines
All Support and
Resistance Levels
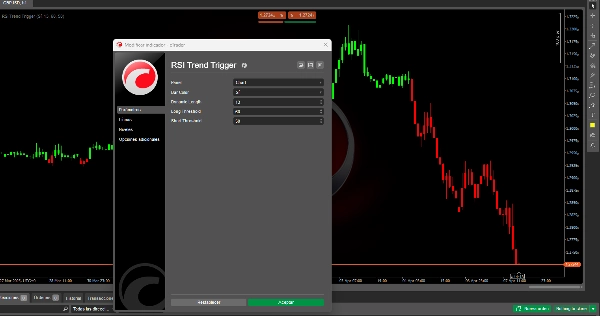
RSI Trend Trigger 📈✨
มันทำงานอย่างไร? 🤔
ขั้นตอนที่ 1: RSI แบบดั้งเดิม
ดัชนี Relative Strength Index (RSI) แบบมาตรฐานถูกคำนวณ โดยวัดความเร็วและขนาดของการเคลื่อนไหวของราคาในช่วงเวลาที่กำหนด มันแกว่งระหว่าง 0 ถึง 100 เพื่อระบุสภาวะที่ซื้อมากเกินไป (เช่น มากกว่า 70) และสภาวะที่ขายมากเกินไป (เช่น ต่ำกว่า 30) 📊📉📈
ขั้นตอนที่ 2: การปรับแต่งแบบไดนามิก
RSI แบบดั้งเดิมได้รับการปรับผ่าน กระบวนการทำให้เรียบขั้นสูง:
- มีการคำนวณทางคณิตศาสตร์ ครั้งที่สอง ถูกนำไปใช้กับค่าของ RSI ดั้งเดิม (ไม่ใช่ราคาตัวเอง)
- ขั้นตอนนี้สร้างเวอร์ชัน RSI ที่เสถียรกว่า ลดความผันผวนเล็กน้อย (เสียงรบกวนของตลาด) และเน้นแนวโน้มที่แท้จริง
- แตกต่างจากการทำให้เรียบแบบพื้นฐาน วิธีนี้ รักษาความไว ต่อการเปลี่ยนแปลงโมเมนตัมที่สำคัญ หลีกเลี่ยงความล่าช้ามากเกินไป 🛡️🔄
ทำไมการปรับแต่งจึงสำคัญ? 🤩
- การกรองอัจฉริยะ: กำจัดสัญญาณเท็จที่เกิดจากความผันผวนชั่วคราว เช่น การพุ่งของข่าวหรือการเคลื่อนไหวเก็งกำไร 🗑️
- แนวโน้มที่ชัดเจนขึ้น: วิธีการคำนวณสองชั้นช่วยแยกความแตกต่างระหว่างการแก้ไขเล็กน้อยและการกลับตัวของแนวโน้มจริง 🎯
- สัญญาณที่คงทน: เมื่อแนวโน้ม (ขาขึ้น/ขาลง) ได้รับการยืนยัน ตัวบ่งชี้จะรักษาสัญญาณนั้นไว้จนกว่าจะเกิดการกลับตัวที่ชัดเจน หลีกเลี่ยงการกระโดดสัญญาณที่ไม่แน่นอน 🔒
การใช้งานจริง: เกณฑ์และการตัดสินใจ 📈
RSI ที่ปรับแต่งแล้วรวมกับ เกณฑ์ที่ปรับได้สองค่า:
- เกณฑ์ขาขึ้น (เช่น 60):
-
- ถ้า RSI ที่ปรับแต่งข้ามระดับนี้ขึ้นไป จะได้รับการยืนยันว่าเป็น แนวโน้มขาขึ้น 🚀
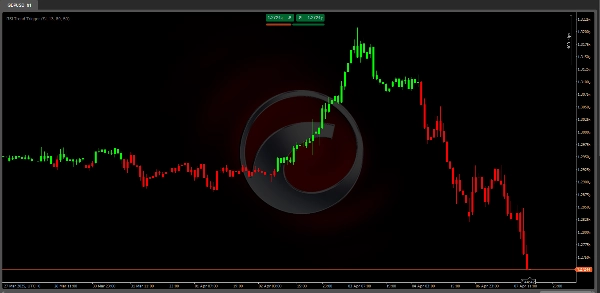
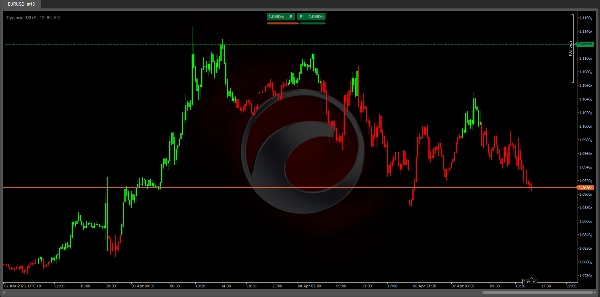
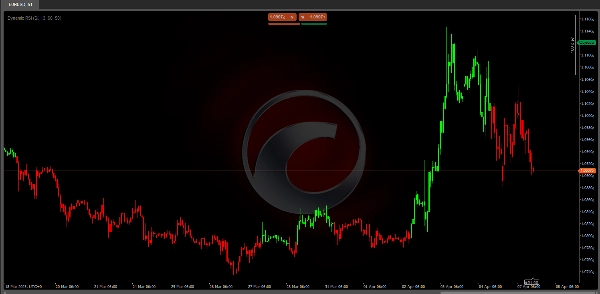
- แท่งเทียนเปลี่ยนเป็นสีเขียว
- เกณฑ์ขาลง (เช่น 50):
-
- ถ้า RSI ที่ปรับแต่งต่ำกว่าระดับนี้ จะถูกกระตุ้นให้เกิด แนวโน้มขาลง 📉
- แท่งเทียนเปลี่ยนเป็นสีแดง
กฎสำคัญ:
- สัญญาณ จะปรากฏเฉพาะเมื่อมีการเปลี่ยนแปลงแนวโน้ม (ไม่ใช่ทุกความผันผวน) ช่วยลดภาระข้อมูลเกินความจำเป็น 🚫📢
- เกณฑ์สามารถปรับแต่งได้: ใช้ค่าสูงขึ้น (เช่น 65/55) สำหรับตลาดที่ผันผวน หรือค่าต่ำกว่า (เช่น 55/45) สำหรับแนวโน้มที่ราบรื่นกว่า ⚙️
ประโยชน์สำหรับเทรดเดอร์ 🏆
- ความแม่นยำที่เพิ่มขึ้น:
-
- สัญญาณเท็จน้อยลงด้วยการกรองสองชั้น เหมาะสำหรับตลาดที่เคลื่อนไหวด้านข้างหรือการหลอกลวง ✅
- การแสดงผลที่เข้าใจง่าย:
-
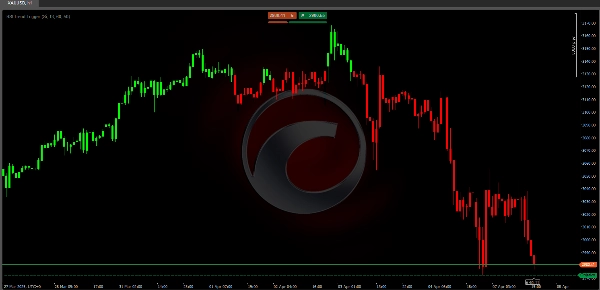
- แท่งเทียนที่มีสีและเกณฑ์ที่มองเห็นได้ช่วยให้คุณเห็นแนวโน้มได้ทันที 👀🎨
- ความสามารถในการปรับตัว:
-
- ทำงานได้กับสินทรัพย์หลายประเภท (ฟอเร็กซ์ หุ้น คริปโต) และกรอบเวลาต่างๆ (นาทีถึงสัปดาห์) 🌍⏳
- การเทรดที่เน้นแนวโน้ม:
-
- ช่วยเทรดตามโมเมนตัม หลีกเลี่ยงการเคลื่อนไหวสวนแนวโน้มที่มีความเสี่ยง 🎯🚦
ตัวอย่างการไหลของสัญญาณ
ลองจินตนาการว่า RSI ที่ปรับแต่งอยู่ที่ 55 (โซนกลาง):
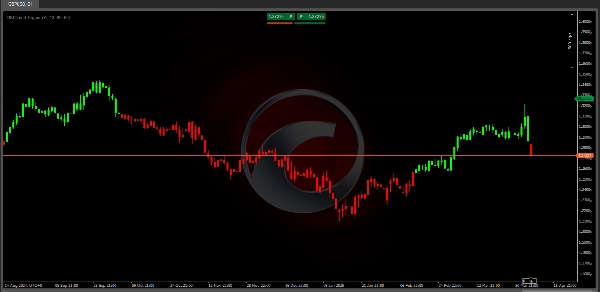
- สถานการณ์ขาขึ้น: เพิ่มขึ้นเป็น 62 → ข้ามเกณฑ์ 60 → แท่งเทียนเปลี่ยนเป็นสีเขียว🚀
- สถานการณ์ขาลง: ลดลงเป็น 48 → ต่ำกว่าเกณฑ์ 50 → แท่งเทียนเปลี่ยนเป็นสีแดง📉
สรุป
The indicator then applies an advanced smoothing process to the RSI values, not the price data, creating a refined RSI that reduces minor market noise while maintaining sensitivity to significant momentum changes. This dual-layer calculation enhances signal precision by filtering out false signals caused by temporary volatility and distinguishing between minor corrections and genuine trend reversals.
Users can customize two threshold levels—a bullish threshold (e.g., 60) and a bearish threshold (e.g., 50)—to define when a trend is confirmed. When the refined RSI crosses above the bullish threshold, the indicator signals a bullish trend with green candles; when it falls below the bearish threshold, it signals a bearish trend with red candles. Signals appear only during trend changes, reducing information overload.
The RSI Trend Trigger supports multiple timeframes from minutes to weeks and is adaptable to different market conditions, aiding traders in aligning with momentum and avoiding counter-trend risks.
รีวิวจากลูกค้า
5 | 67 % | |
4 | 33 % | |
3 | 0 % | |
2 | 0 % | |
1 | 0 % |