PRICE LADDER PRO 3.1
Indicateur
Version 1.0, Apr 2026
Windows, Mac
5.0
Avis : 1
Trading product for PRICE LADDER PRO 3.1 Indicateur Key Levels ATR, image 2
Trading product for PRICE LADDER PRO 3.1 Indicateur Key Levels ATR, image 3
Trading product for PRICE LADDER PRO 3.1 Indicateur Key Levels ATR, image 4
Trading product for PRICE LADDER PRO 3.1 Indicateur Key Levels ATR, image 5
117
Ventes
9.97K
Installations gratuites

Description

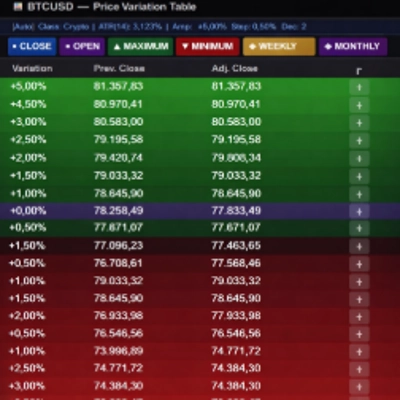
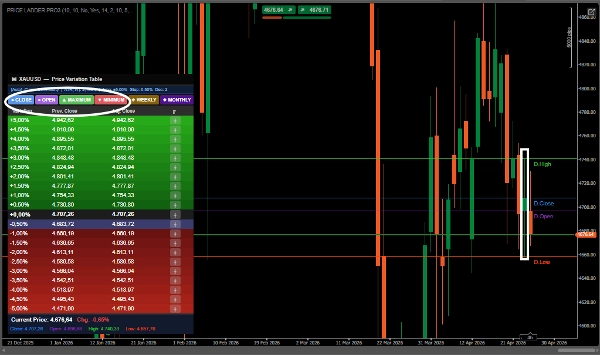
Ceci est un outil de lecture des prix institutionnels basé sur des niveaux en pourcentage + référence de liquidité.


🧠 Reconnaissance de la classe d'actifs

Forex, Crypto, Indices, Matières premières, Actions, Futures


🔎 CE QUE CET INDICATEUR FAIT RÉELLEMENT

Il transforme le marché en :

1. 📊 Zones en pourcentage à partir de la clôture précédente

Ex : +0,5 %, +1 %, -1 %, -2 %...

Cela crée une sorte de carte d'expansion des prix


👉 Ceci est TRÈS utilisé par les investisseurs institutionnels (volatilité quotidienne implicite)

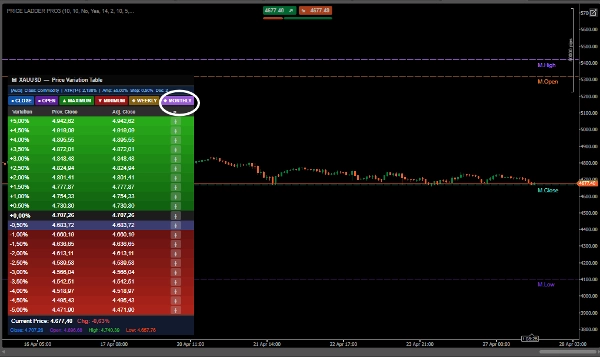
📍 Niveaux clés automatiques


Vous pouvez activer :

Clôture précédente

Ouverture précédente

Haut/bas

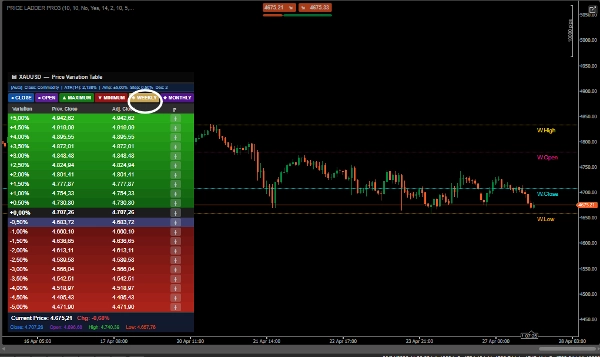
Fourchette hebdomadaire


👉 Ceci = liquidité + référence institutionnelle


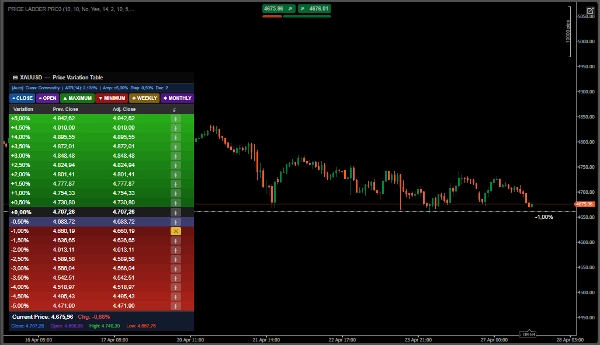
3. 🎯 Lignes personnalisées (bouton ╋)

Vous pouvez marquer manuellement des niveaux importants


👉 Cela devient un support/résistance dynamique

🧠 MEILLEURES STRATÉGIES D'UTILISATION


1. 🚀 Stratégie BREAKOUT ET EXPANSION (la meilleure)

Comment l'utiliser :

Connectez :

Clôture précédente

Haut / bas

Hebdomadaire ou mensuel

Note :

Si le prix casse :

Haut précédent

+1 % / +1,5 % / +2 % (calcul automatique de la variation par actif)


👉 Cela indique une expansion institutionnelle


2. 🔄 Stratégie REVERSAL (retour à la moyenne)

Cet indicateur est excellent pour cela.

Comment l'utiliser :

Si le prix atteint :

+2 % / +3 %

ou -2 % / -3 %


👉 Forte probabilité de :

Repli d'épuisement

Entrée :

✔ Vendre :

Région +2 % ou +

Avec rejet (mèche/bougie)

✔ Acheter :

Région -2 % ou -

Objectif :

Retour à :


👉 0 % (clôture précédente)

👉 Cela fonctionne TRÈS bien sur :

XAUUSD EURUSD en mouvement latéral


3. 🏦 Stratégie INSTITUTIONNELLE (meilleure utilisation réelle)

C'est là que votre indicateur brille.

Concept :

Les investisseurs institutionnels pensent ainsi :

Où se situe le prix par rapport à la veille ?

Combien s'est-il étendu ?

Il y a encore de la marge d'amélioration.

Principales caractéristiques de la stratégie Turtle :


1. Niveaux de Breakout Automatiques

Affiche le Haut et le Bas de la période précédente (hier/semaine/mois)

Affiche la Clôture et l'Ouverture comme points de référence

Parfait pour identifier les breakouts sur 20/55 jours (vous pouvez adapter cela)


2. Niveaux d'Expansion par Variation en Pourcentage

Similaire au concept d'unité de volatilité de Turtle

Permet de voir les niveaux de prix avec une variation de X %

Utile pour fixer des objectifs de profit (par ex., 2 % au-dessus du breakout)


3. Boutons Rapides

MAXIMUM/MINIMUM : Affiche les niveaux de résistance/support

HEBDOMADAIRE/MENSUEL : Saisonnalité à long terme


4. Ajustement Automatique par ATR

L'ATR est le cœur de Turtle (positionnement par volatilité)

Calcule automatiquement les plages basées sur la volatilité réelle


Résumé

Profil de l'indicateur
Catégorie de l'indicateur
Statistiques
Type de résultat
Visualisation
Exigences en matière de données
Données de tick
Signaux pris en charge
Dépassement de niveau

Avis clients

5.0
Avis : 1
5
100 %
4
0 %
3
0 %
2
0 %
1
0 %
Avis clients
May 2, 2026
Not bad if the rules are already clear. A clean signal can still fail.

Discussion

Questions fréquentes

Key Levels
ATR
Support & Resistance
Les produits disponibles sur cTrader Store, notamment les bots de trading, les indicateurs et les plug-ins, sont fournis par des développeurs tiers et mis à disposition à titre informatif et à des fins d'accès technique uniquement. cTrader Store n'est pas un courtier et ne fournit aucun conseil en investissement, aucune recommandation personnelle ni aucune garantie quant aux performances futures.

Plus de cet auteur

cBot
Forex
BTCUSD
+5
Intelligent negotiations and analysis!
47.3%
ROI
3
Facteur de profit
cBot
XAUUSD
Scalping
Precision Scalper,XAUUSD ,Averages that functions like a multidimensional radar:
34.8%
ROI
2.12
Facteur de profit
Indicateur
Order BlockIndicator reversal
cBot
ATR
RSI
+4
Intelligent system, Available any instrument. Profit 12. Drawdown 1%
12.29
Facteur de profit
Indicateur
Forex
Fair Value Gap
Volume Profile Price Period and Live VAH,VAL,POC,
cBot
RSI
MACD
+2
Chart Patterns Algo Bot
Indicateur
SMC
Prop
+12
BoS ChoCH Pro,Strict Mode,False Breakout Filter,Average hit rate: 72-78%
Indicateur
Forex
BTCUSD
+5
INDICATOR,LIQUIDITY POOLS,ACCURATE SIGNAL, NO DELAY,80% PROBABILITY
Indicateur
PVA Volume Analysis Indicator:Price volume over trend strength and direction
cBot
EMA
BTCUSD
+5
Precision Scalper Bots QUANT ,XAUUSD ,
13.8%
ROI
3
Facteur de profit
Indicateur
Signal
Indicator,combines with several strategies.MA locate trends,pullback, signal volumes, reversals, support and resistance
Indicateur
RSI
Forex
+12
Indicator pattern signal moment

Vous pourriez aussi aimer

Indicateur
BOS
CHOCH
+4
Dual-track market structure detection with BVC order flow confirmation and two-stage liquidity sweep validation.
Indicateur
Indices
this indicator shows previous day high low and closed with precise manner.
Indicateur
SMC
VWAP
+16
It calculates Anchored VWAP and StdDev bands from a user-defined start date for cTrader charts.
Indicateur
Forex
Flexible Volume Profile, designed with performance in mind.
Indicateur
AI
ATR
+25
On-chart draggable panel to show/hide Positions & Pending Orders with fixed warning banner and inline alerts per symbol.
Indicateur
Prop
Forex
+4
Pivot Points Standard — All-in-One Multi-Timeframe Pivot Indicator for cTrader
Indicateur
VWAP
Volume
+3
Don't trust static support and resistance levels, this indicator combines Fibonacci and VWAP in one powerful tool.
Indicateur
Supply & Demand
Support & Resistance
RAF Supply Demand Lite v1.0 automatically detects clean Supply and Demand zones using confirmed swing highs and lows. Zo
Indicateur
BOS
EMA
+5
Directional volume heatmap: see if a price zone was built on buying or selling, not just how much.
Indicateur
ATR
Volume
+4
This allows traders to see not just the trend, but whether the momentum itself is overextended.
Indicateur
Prop
Forex
+14
🚀See the market’s framework, decide faster. Session-Aware Pivots. Auto Presets. Pro-Grade Zones.🚀
Indicateur
Plots intraday VWAP and dynamic ±1/±2 standard deviation (SD) bands based on current day’s price and volume.
Indicateur
SMC
Forex
+4
Identifies institutional zones with Volume Delta (K) across any asset or chart for high-precision entry detection.
Indicateur
ATR
RSI
+1
AI Supertrend MTF uses K-NN Machine Learning to eliminate lag. Features multi-timeframe projection & dynamic glowing clo
Indicateur
AI
BOS
+4
Golden Boom and Crash Spike Detector is a trading tool designed for Crash 300 and Boom 300 indices on M1 Timeframe.
Indicateur
Boost your trading with Candlestick Patterns for cTrader – auto-detect key signals for smarter, faster decisions!
Indicateur
Key Levels
Liquidity Sweep
Professional Opening Range Breakout, Initial Balance, False breakout Detection
Indicateur
Zero Lag MACD delivers ultra-responsive trend and divergence signals with minimal lag, empowering timely Forex entries.

Prix

117
Ventes
9.97K
Installations gratuites